
Fig. 2.
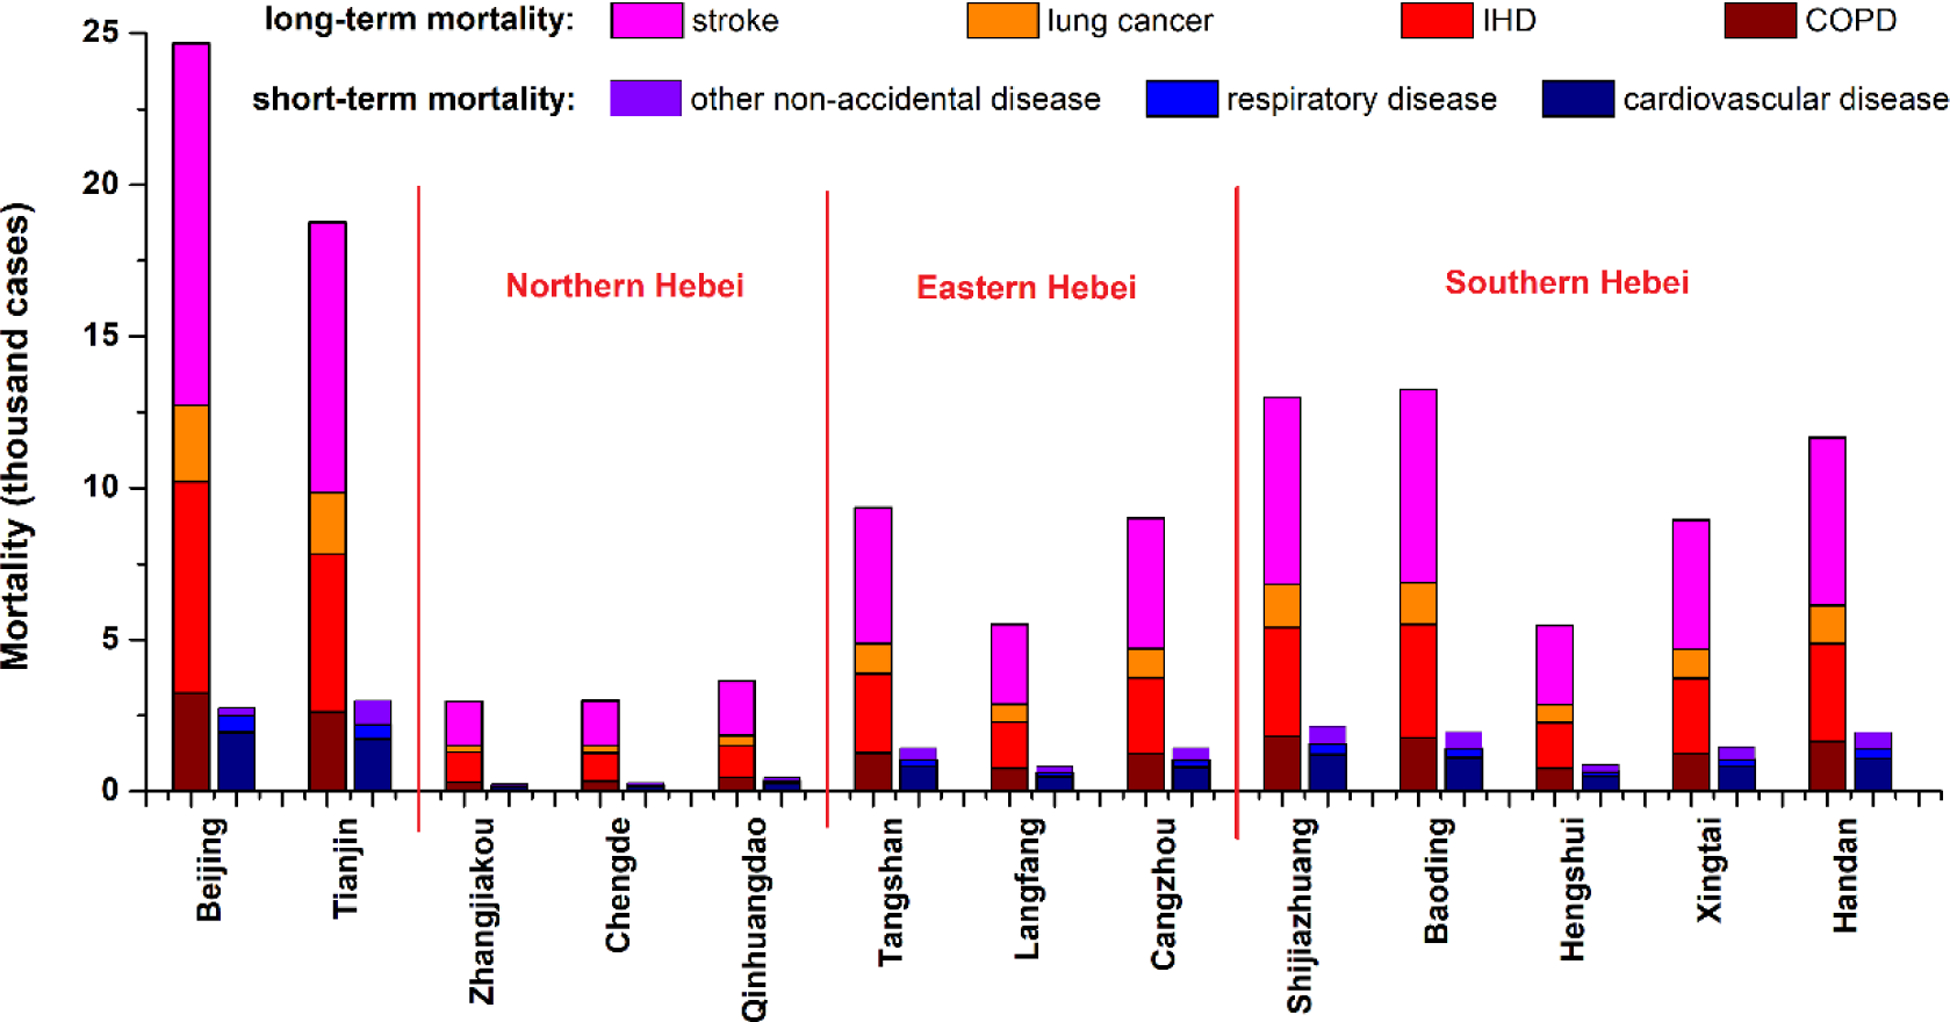
Premature mortality due to PM2.5 pollution in the BTH region. The two sets of colored bars for each city refer to mortality due to long-term and short-term exposures, respectively. Only median values of the mortality estimates are displayed in this figure.