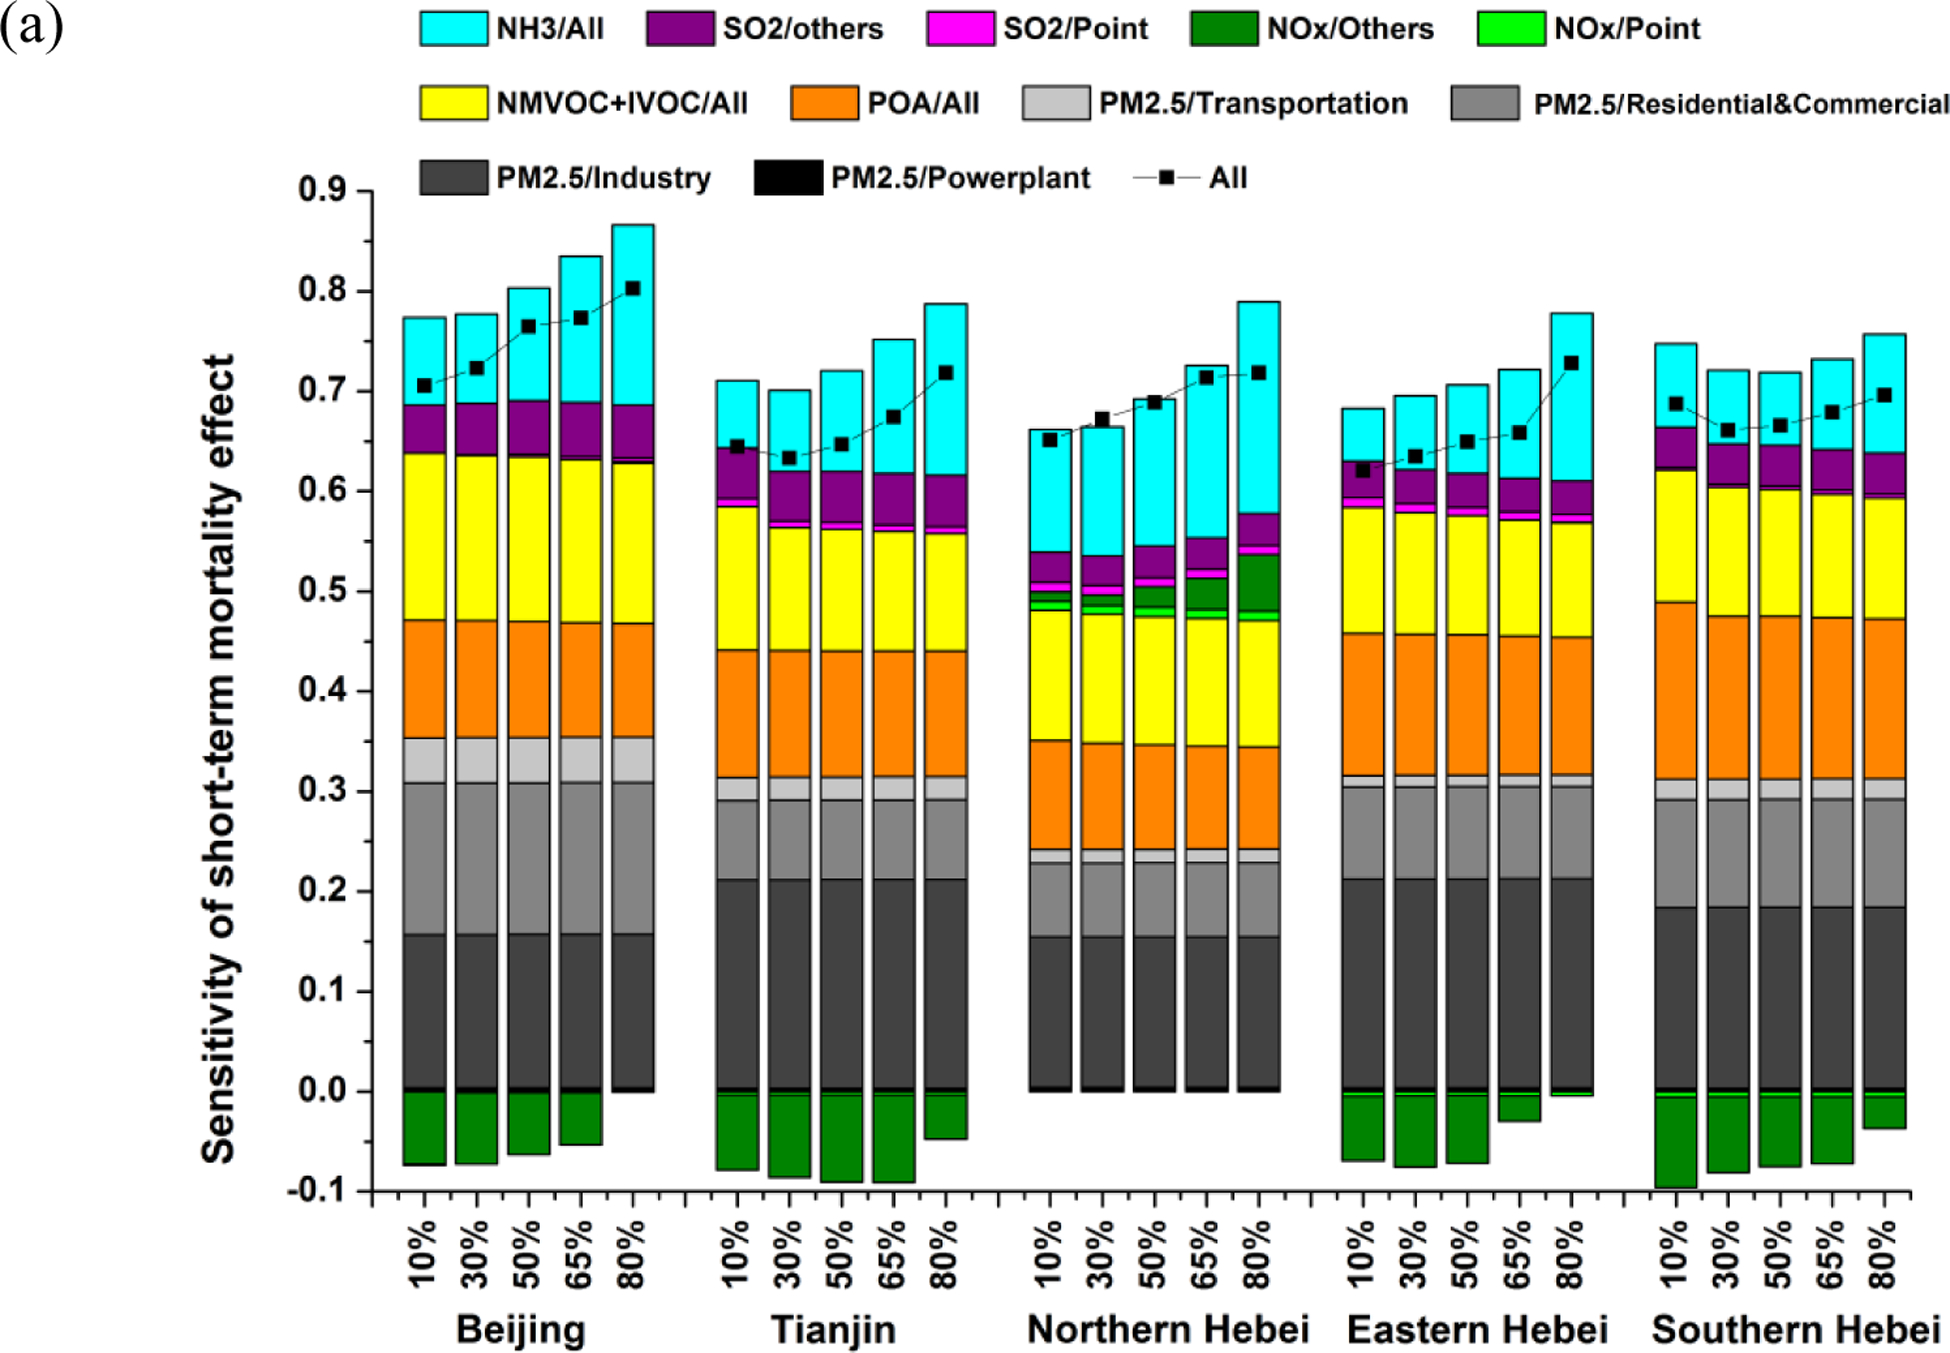
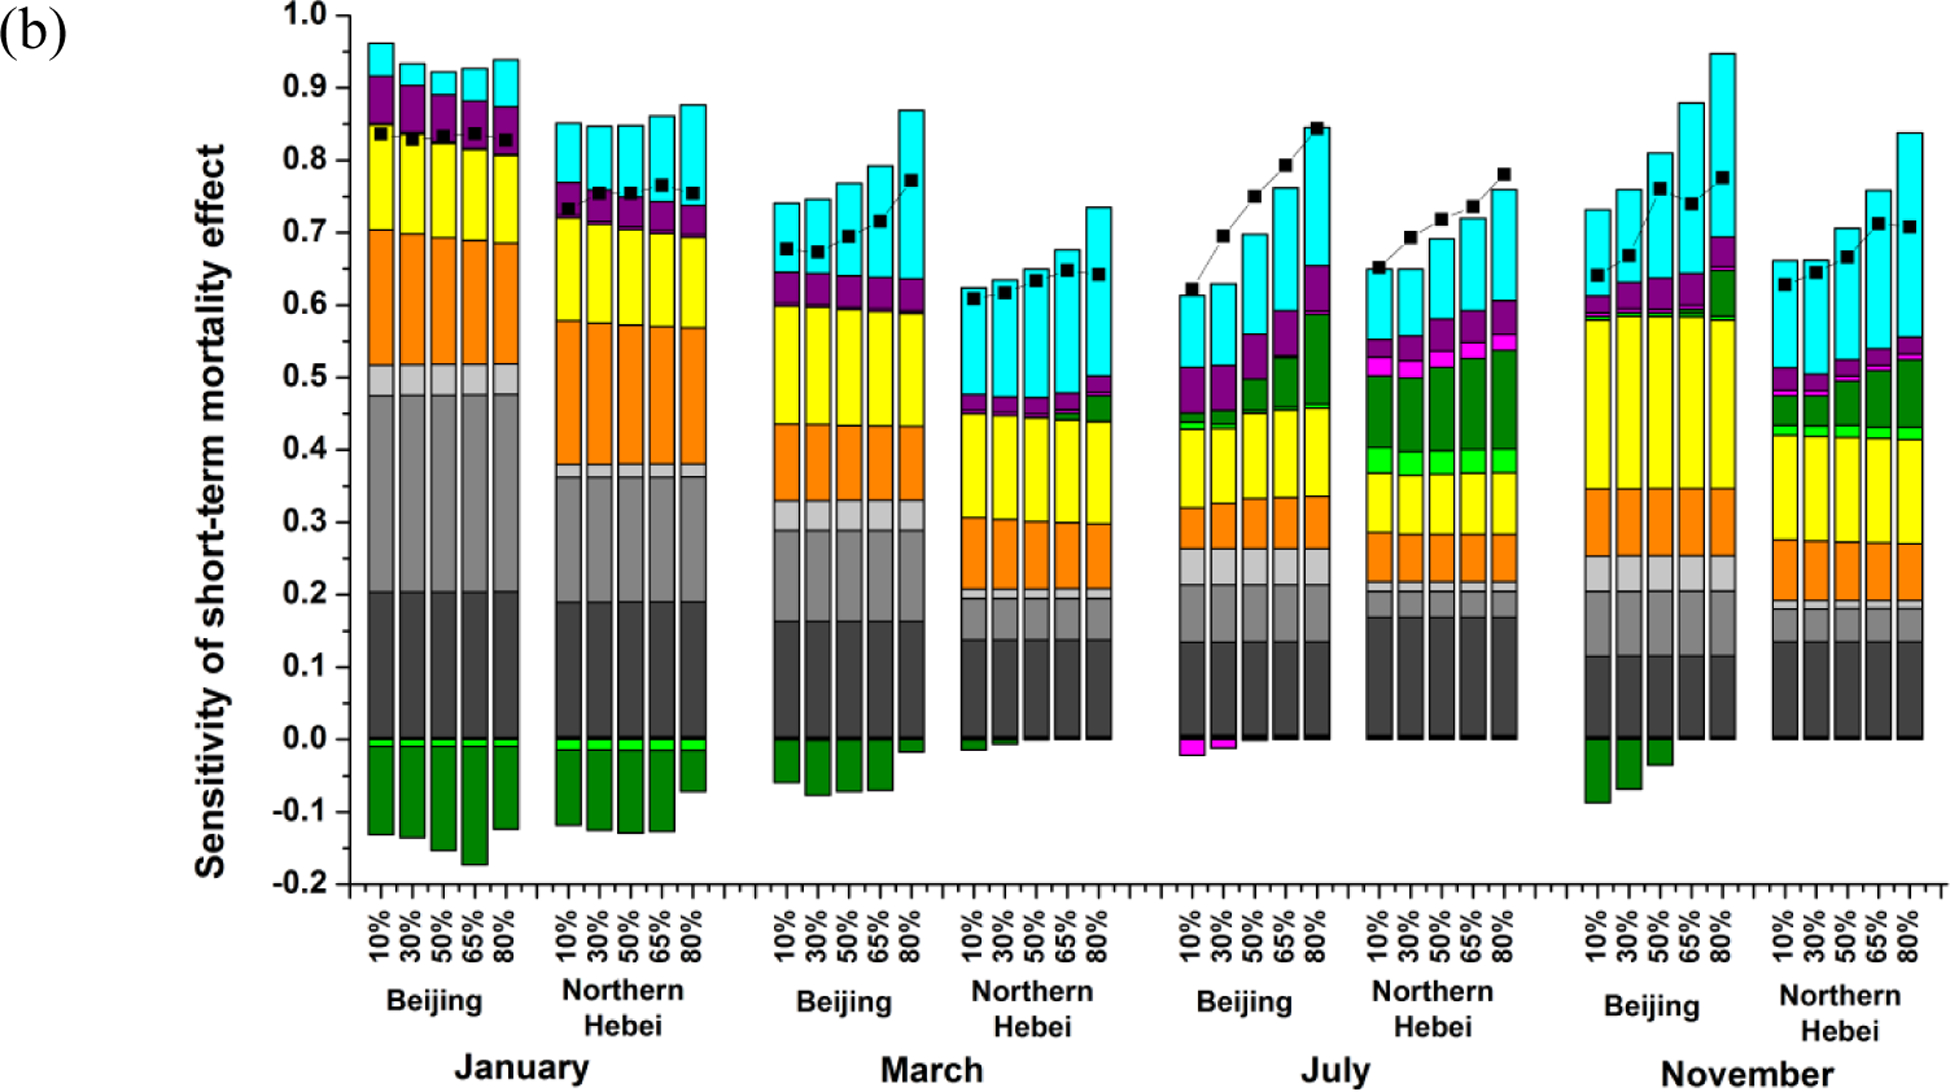
Fig. 4.


Sensitivity of annual mean (a) and monthly mean (b) short-term PM2.5-related mortality to stepped control of individual pollutant-sector combinations. The meanings of X-axis, Y-axis, colored bars, and black dotted lines are the same as Fig. 3.
