
Figure.
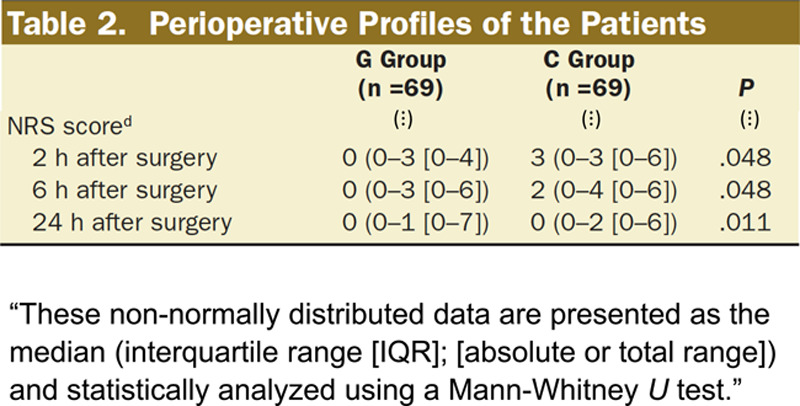
Adapted text excerpt from the statistical methods section of Wang et al1 and their Table 2. These authors used Mann-Whitney U tests to compare patient self-reported NRS pain scores (the secondary outcome), which were not normally distributed, between their chewing gum group (G Group) and the control group (C Group). NRS indicates numeric rating scale.