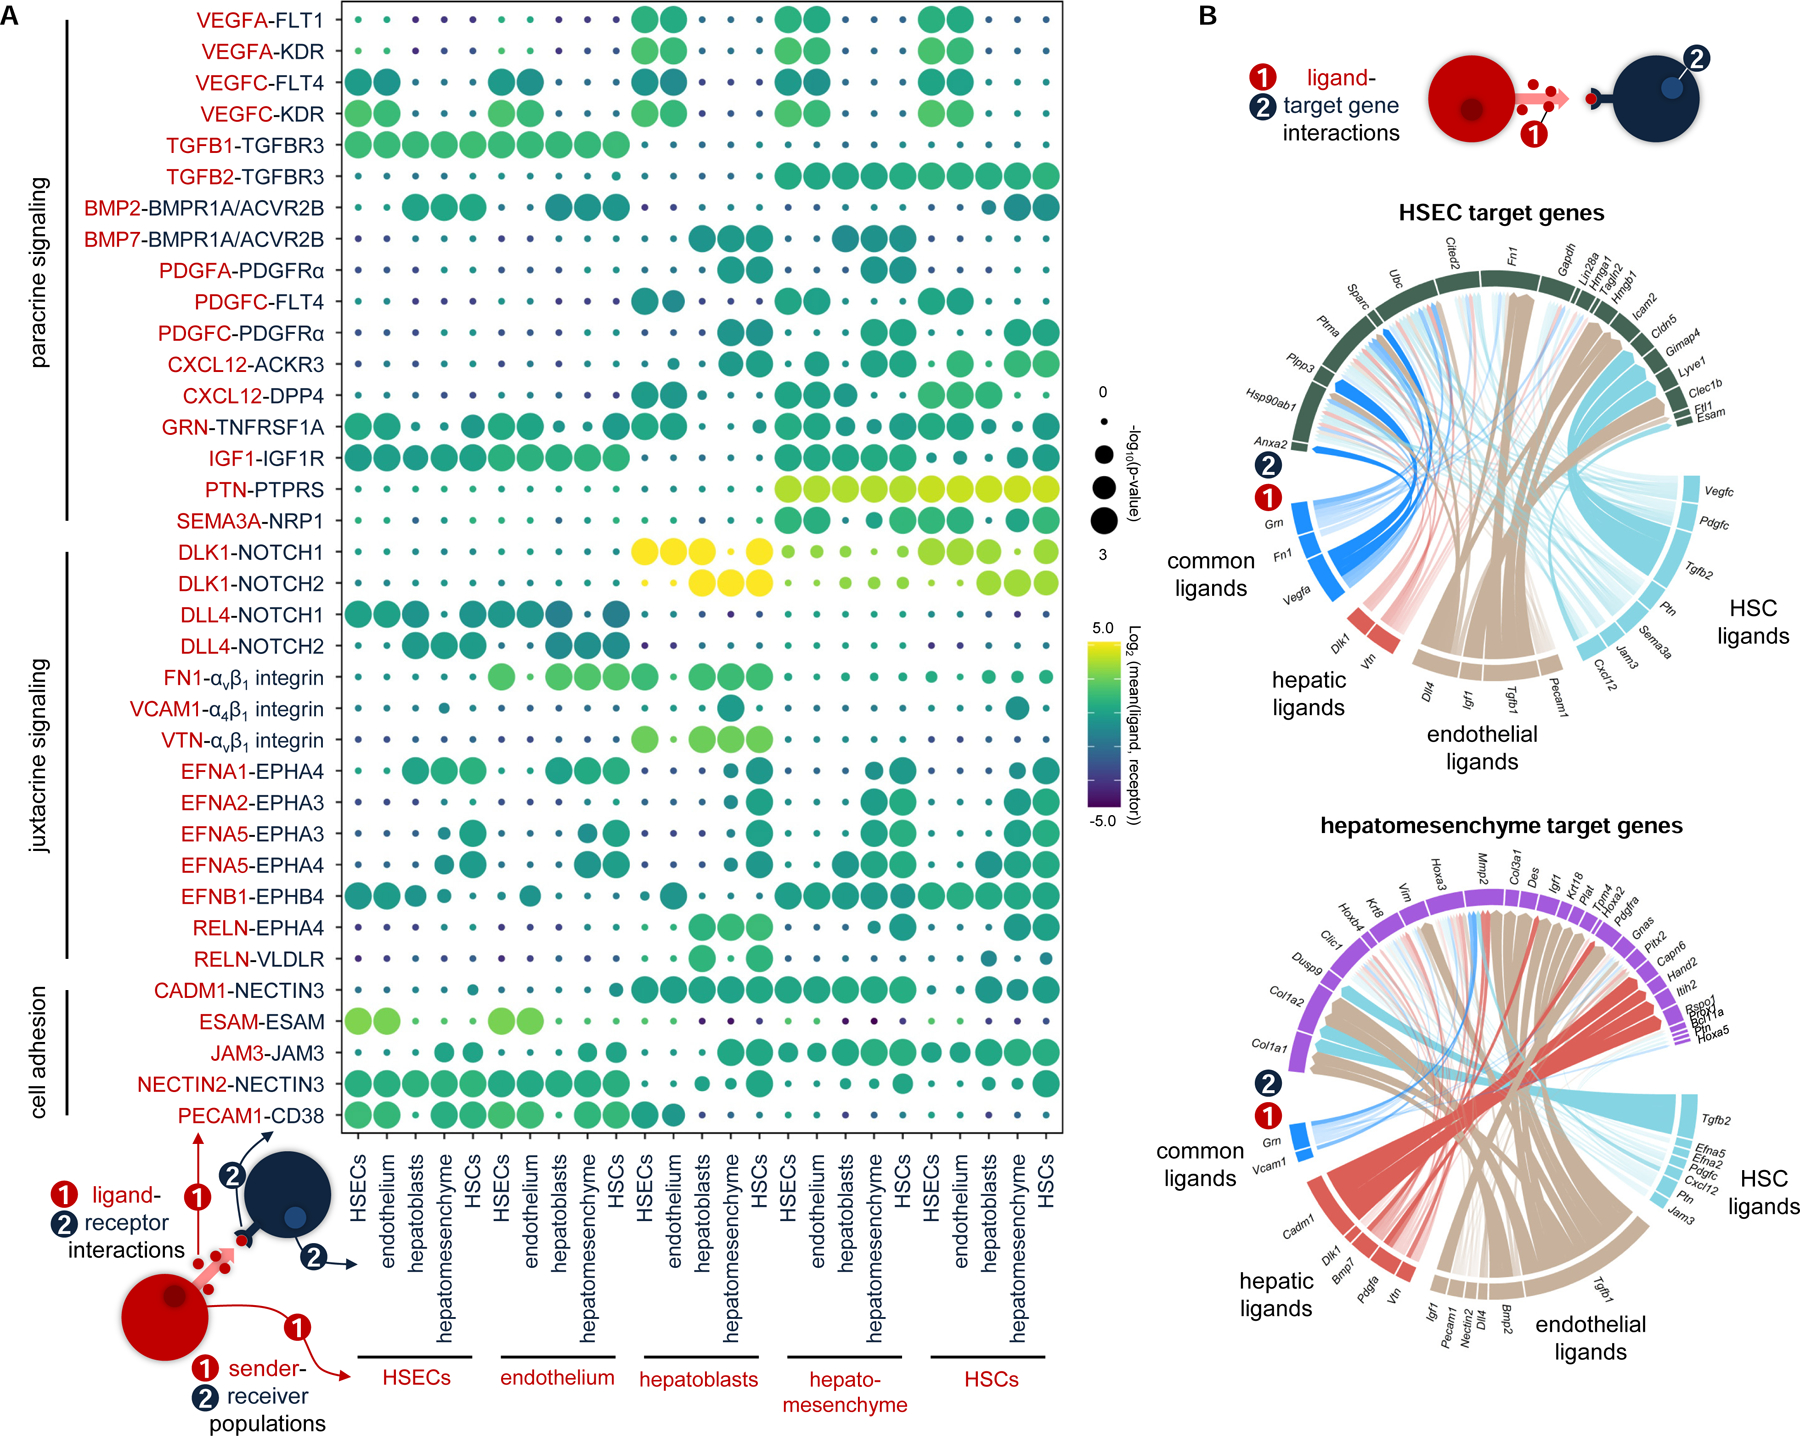
Figure 6.

The signaling niche of the primitive sinusoid.
(A) Dotplot displaying putative ligand-receptor interactions between hepatoblast, HSEC, endothelial, hepatomesenchymal, and HSC lineages captured at E10.5. Size of the dot represents statistical significance of the indicated interactions. Color indicates the means of the average expression level of the ligand from cluster 1 and the receptor from cluster 2. (B) Circle plots depicting links between (1) ligands and (2) their predicted target genes for HSECs and hepatomesenchymal cells. Link colors indicate ligand sender populations, whereas width and opacity of links correlate to ligand-receptor interaction weights and ligand activity scores, respectively. HSCs, hepatic stellate cells; HSECs, hepatic sinusoidal endothelial cells. See also Figure S5 and Tables S4 and S5.
