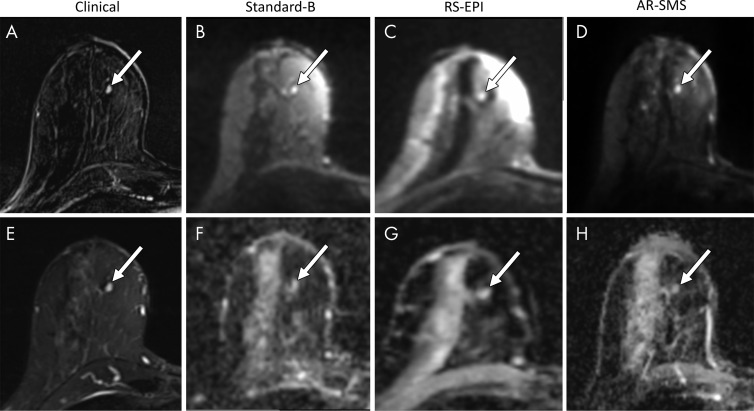
Figure 3:
Small lesion example. Shown are, A, a contrast-enhanced subtraction image, E, a T2-weighted image, B–D, images with b value of 800 sec/mm2, and, F–H, apparent diffusion coefficient (ADC) maps, focused on an example of a small contrast-enhanced lesion (arrow). Radiologists were asked to measure the longest dimension on images with b value of 800 sec/mm2 (B–D) and a lesion-average ADC by drawing a freehand two-dimensional region of interest on each ADC map (F–H). The longest lesion diameter was 4.7 mm, measured on the contrast-enhanced subtraction image (A) and averaged across all readers. Average measurements on images with b value of 800 sec/mm2 were as follows: B, standard, 5.8 mm; C, readout-segmented (RS) echo-planar imaging (EPI), 4.6 mm; and D, axially reformatted (AR)–simultaneous multislice (SMS) image, 5.5 mm. Average ADC measurements were as follows: F, standard, 1.45 × 10⁻³ mm2/sec; G, RS echo-planar image, 1.59 ×10⁻³ mm2/sec; and H, R-SMS image, 1.34 ×10⁻³ mm2/sec. The average quality scores on a five-point LIkert scale were as follows: standard, 2.3; RS echo-planar imaging, 2.7; and AR-SMS imaging, 3.7.

