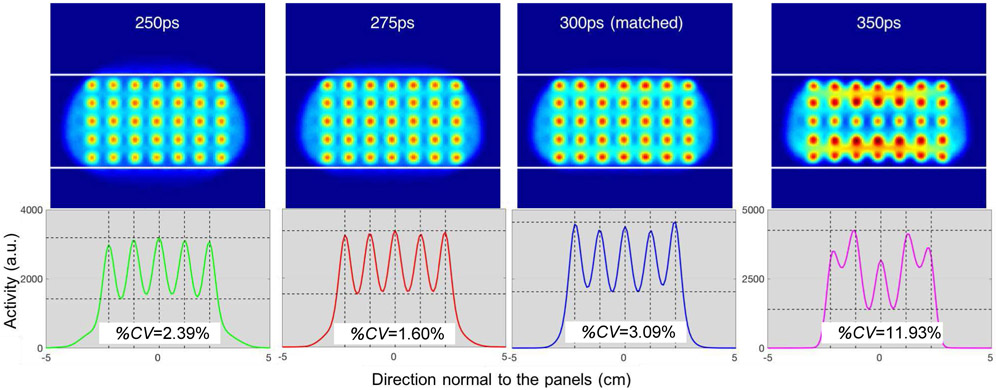
Fig. 9.
Breast images with lesions reconstructed (iteration 60) using different TOF kernel widths. Top row: reconstructed images (white lines denote the object boundaries). Bottom row: corresponding vertical profiles across the five lesions located at the center of the breast with the %CV as the measure of uniformity across the lesion peak values (vertical dashed lines mark the true centers of each simulated lesion and horizontal dashed lines delineate the maximum peak and minimum valley for each case.). 1st column: 250ps (−16%) TOF kernel, 2nd column: 275ps (−8%) TOF kernel, 3rd column: matched 300ps TOF kernel, 4th column: 350ps (+16%) TOF kernel. Narrowing the TOF kernel size to 275ps delivers more consistent lesion activity recovery than the matched kernel of 300ps. For clarity, images have been smoothed with a 5mm FWHM isotropic 3D Gaussian kernel, which corresponds to the diameter of the lesion.

