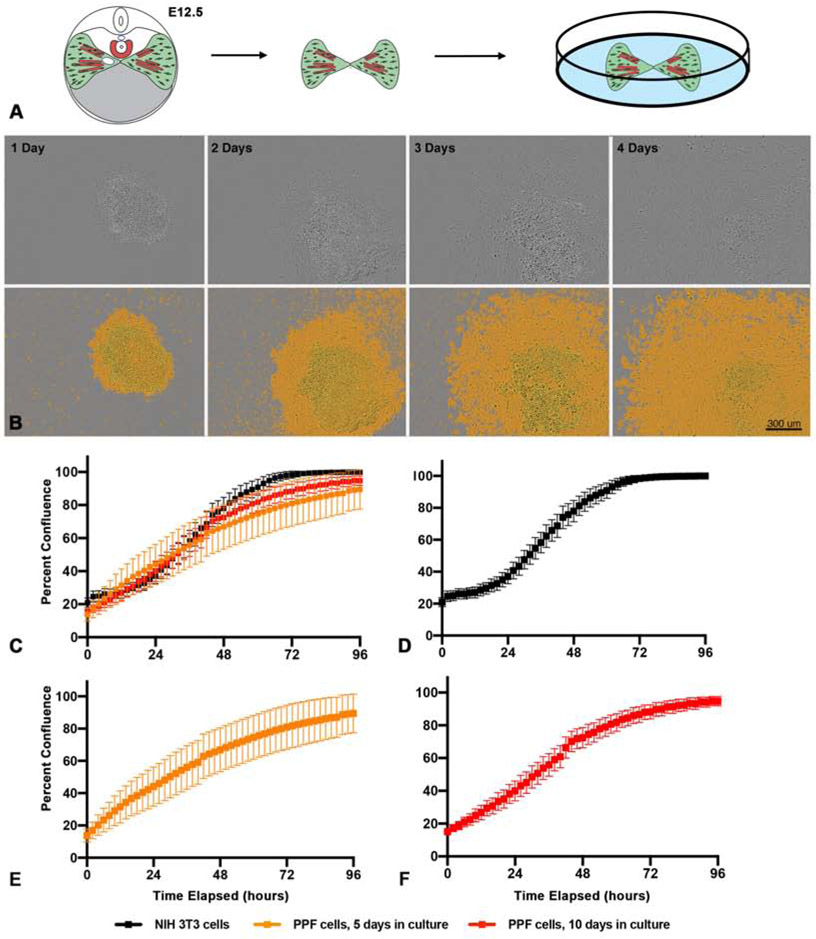
Figure 1. PPFs can be isolated and cultured in vitro.
A. E12.5 pairs of PPFs, including muscle progenitors, are dissected from embryos and cultured individually in single wells of 96-well culture plates. B. Growth of E11.5 PPFs 1 - 4 d after isolated. Top row, phase-contrast images taken by IncuCyte cell imager. Bottom row, images with IncuCyte-created confluency mask layer to highlight cells (in orange).
Scale bar is 300 μm. C-F. Comparison of growth of PPFs and NIH3T3 fibroblast (C). Growth of NIH 3T3 cells (D, n = 10 biological replicates), PPF cells after 5 d in culture and 1 passage (E, n = 21 biological replicates) and PPF cells after 10 d in culture and 2 passages (F, n = 30 biological replicates). Growth is measured by percent confluency calculated by IncuCyte software and for each timepoint the average of the biological replicates are shown with error bars representing standard error of the mean (SEM).

