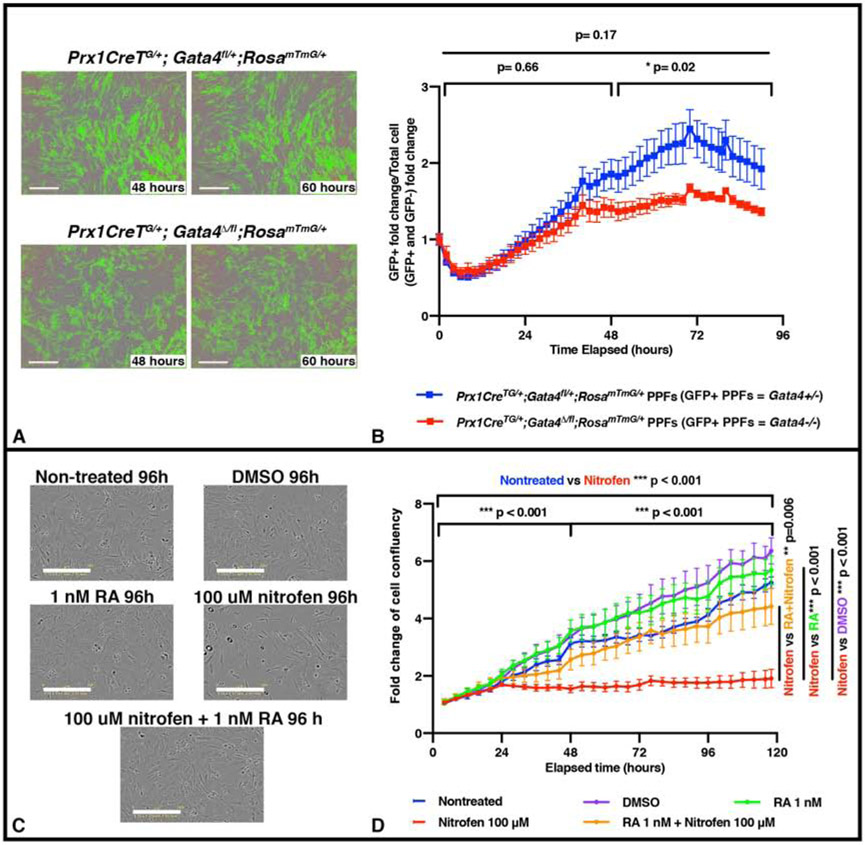
Figure 4. In vitro proliferation of PPF fibroblasts is inhibited by genetic mutation and pharmacological inhibitor previously demonstrated to cause CDH in vivo.
A-B. E12.5 PPFs isolated from either Prx1CreTg/+;Gata4fl/+;RosamTmG/+ (with GFP+ Gata4+/− PPFs, n = 2 biological replicates, 2 technical replicates) or Prx1CreTg/+;Gata4del/fl;RosamTmG/+ (with GFP+ Gata4 −/− PPFs, n = 3 biological replicates, 2 technical replicates) embryos and cultured after 5 d (one passage) on the IncuCyte ZOOM, with GFP (to measure confluence of GFP+ cells) and phase (to measure confluence of all cells). Representative GFP and phase images shown in (A). The average ratio GFP+ PPF fold change (% confluence at time T/% confluence at time 0) over total PPF+ fold change +/− SEM is plotted (B). C-D. E12.5 PPFs were cultured after 5 d (and one passage) either untreated (n = 5), treated with DMSO (n = 5), treated with RA, treated with nitrofen (n = 5), or treated with RA plus nitrofen (n = 5) on the IncuCyte ZOOM to track cell confluency via phase images. Representative phase images shown in (C). Average fold change (% confluence at time T/% confluence at time 0) +/− SEM is plotted in (D). Statistical changes in total confluency over time were determined using repeated measure ANOVA on the log2 transformed fold change over time, with bars on top of graphs denoting whether comparison was between T=0 to T= total time elapsed, or through the first or last halves of the experiments (B, D) Bars on side of graph (D) are comparing across entire lapsed time. *** P= <0.001, * P= <0.05.

