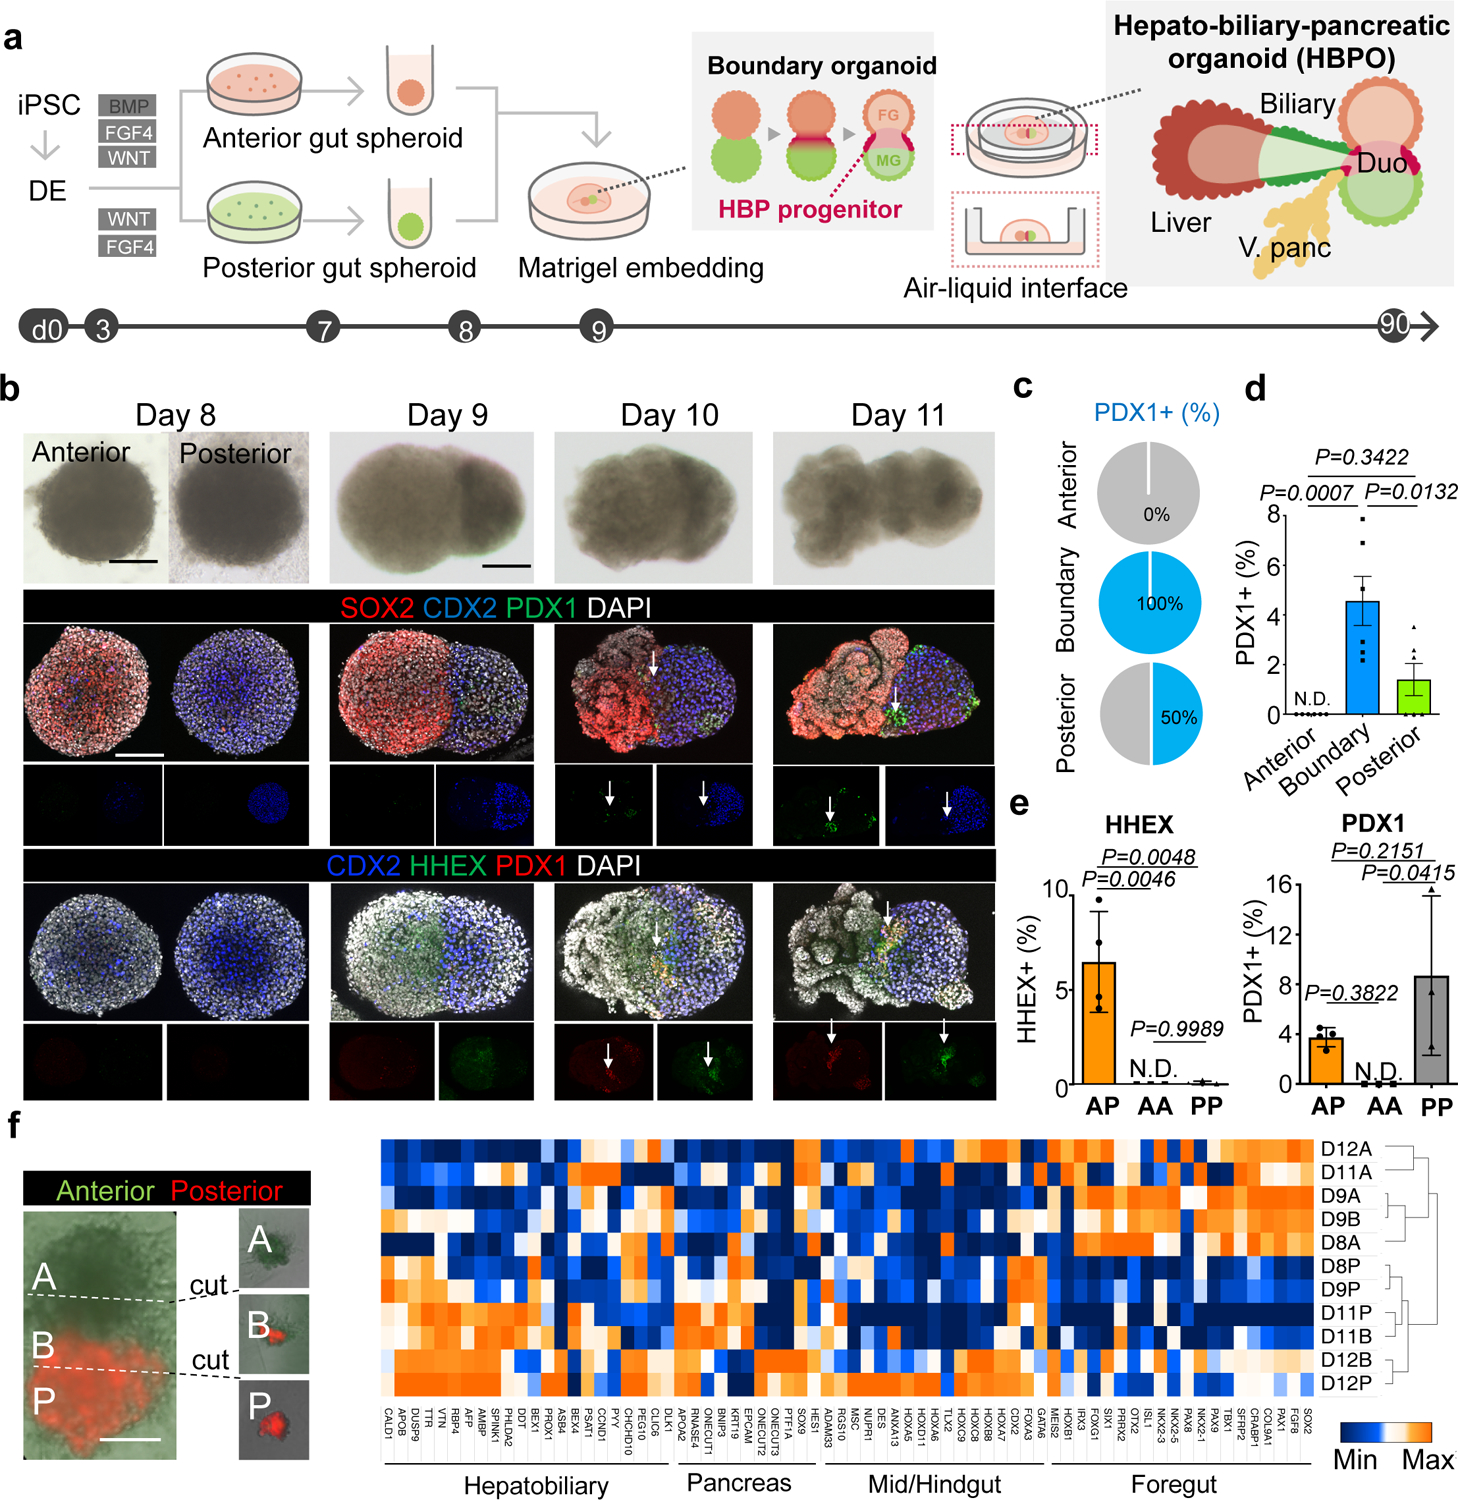
Figure 1. Boundary organoid generates multi-endoderm domains.

a. Schematic overview for the hepato-biliary-pancreatic (HBP) organoid from PSC (see, video S1).
b. Tracing of fused spheroids from day 8 to day 11. Upper: Bright-field. Middle: wholemount immunostaining for SOX2, PDX1 and CDX2. Lower: wholemount immunostaining for CDX2, HHEX and PDX1. Arrow: PDX1 and HHEX positive region. Independent 12 samples were analyzed with similar results.
c. Frequency of PDX1 positive cell in each area of fused spheroid.
d. Percentages of PDX1 positive cells in each area compared to DAPI stained total cells numbers. Data are mean ± s.e.m. (n = 6), one-way ANOVA, followed by Tukey’s test.
e. Percentage of HHEX and PDX1 positive cells in anterior-posterior (AP) (n = 4), anterior-anterior (AA) (n = 3) and posterior-posterior (PP) (n = 3) combination at day11 compared to total cell numbers. Data are mean ± s.d., one-way ANOVA, followed by Tukey’s test.
f. Transcriptomic characterization of boundary organoids using the gene-sets of anterior foregut, liver/biliary/pancreas primordium and mid/hindgut markers reported 32,33. From day 8 (D8) to day 12 (D12), anterior (A), boundary (B), and posterior (P) domains were dissected and applied for RNAseq as indicated in left representative image. Independent 12 organoids for D11 and 30 organoids for D9 and D12 were microdissected with similar results.
Scale bars, 50 µm (f), 100 µm (b).
