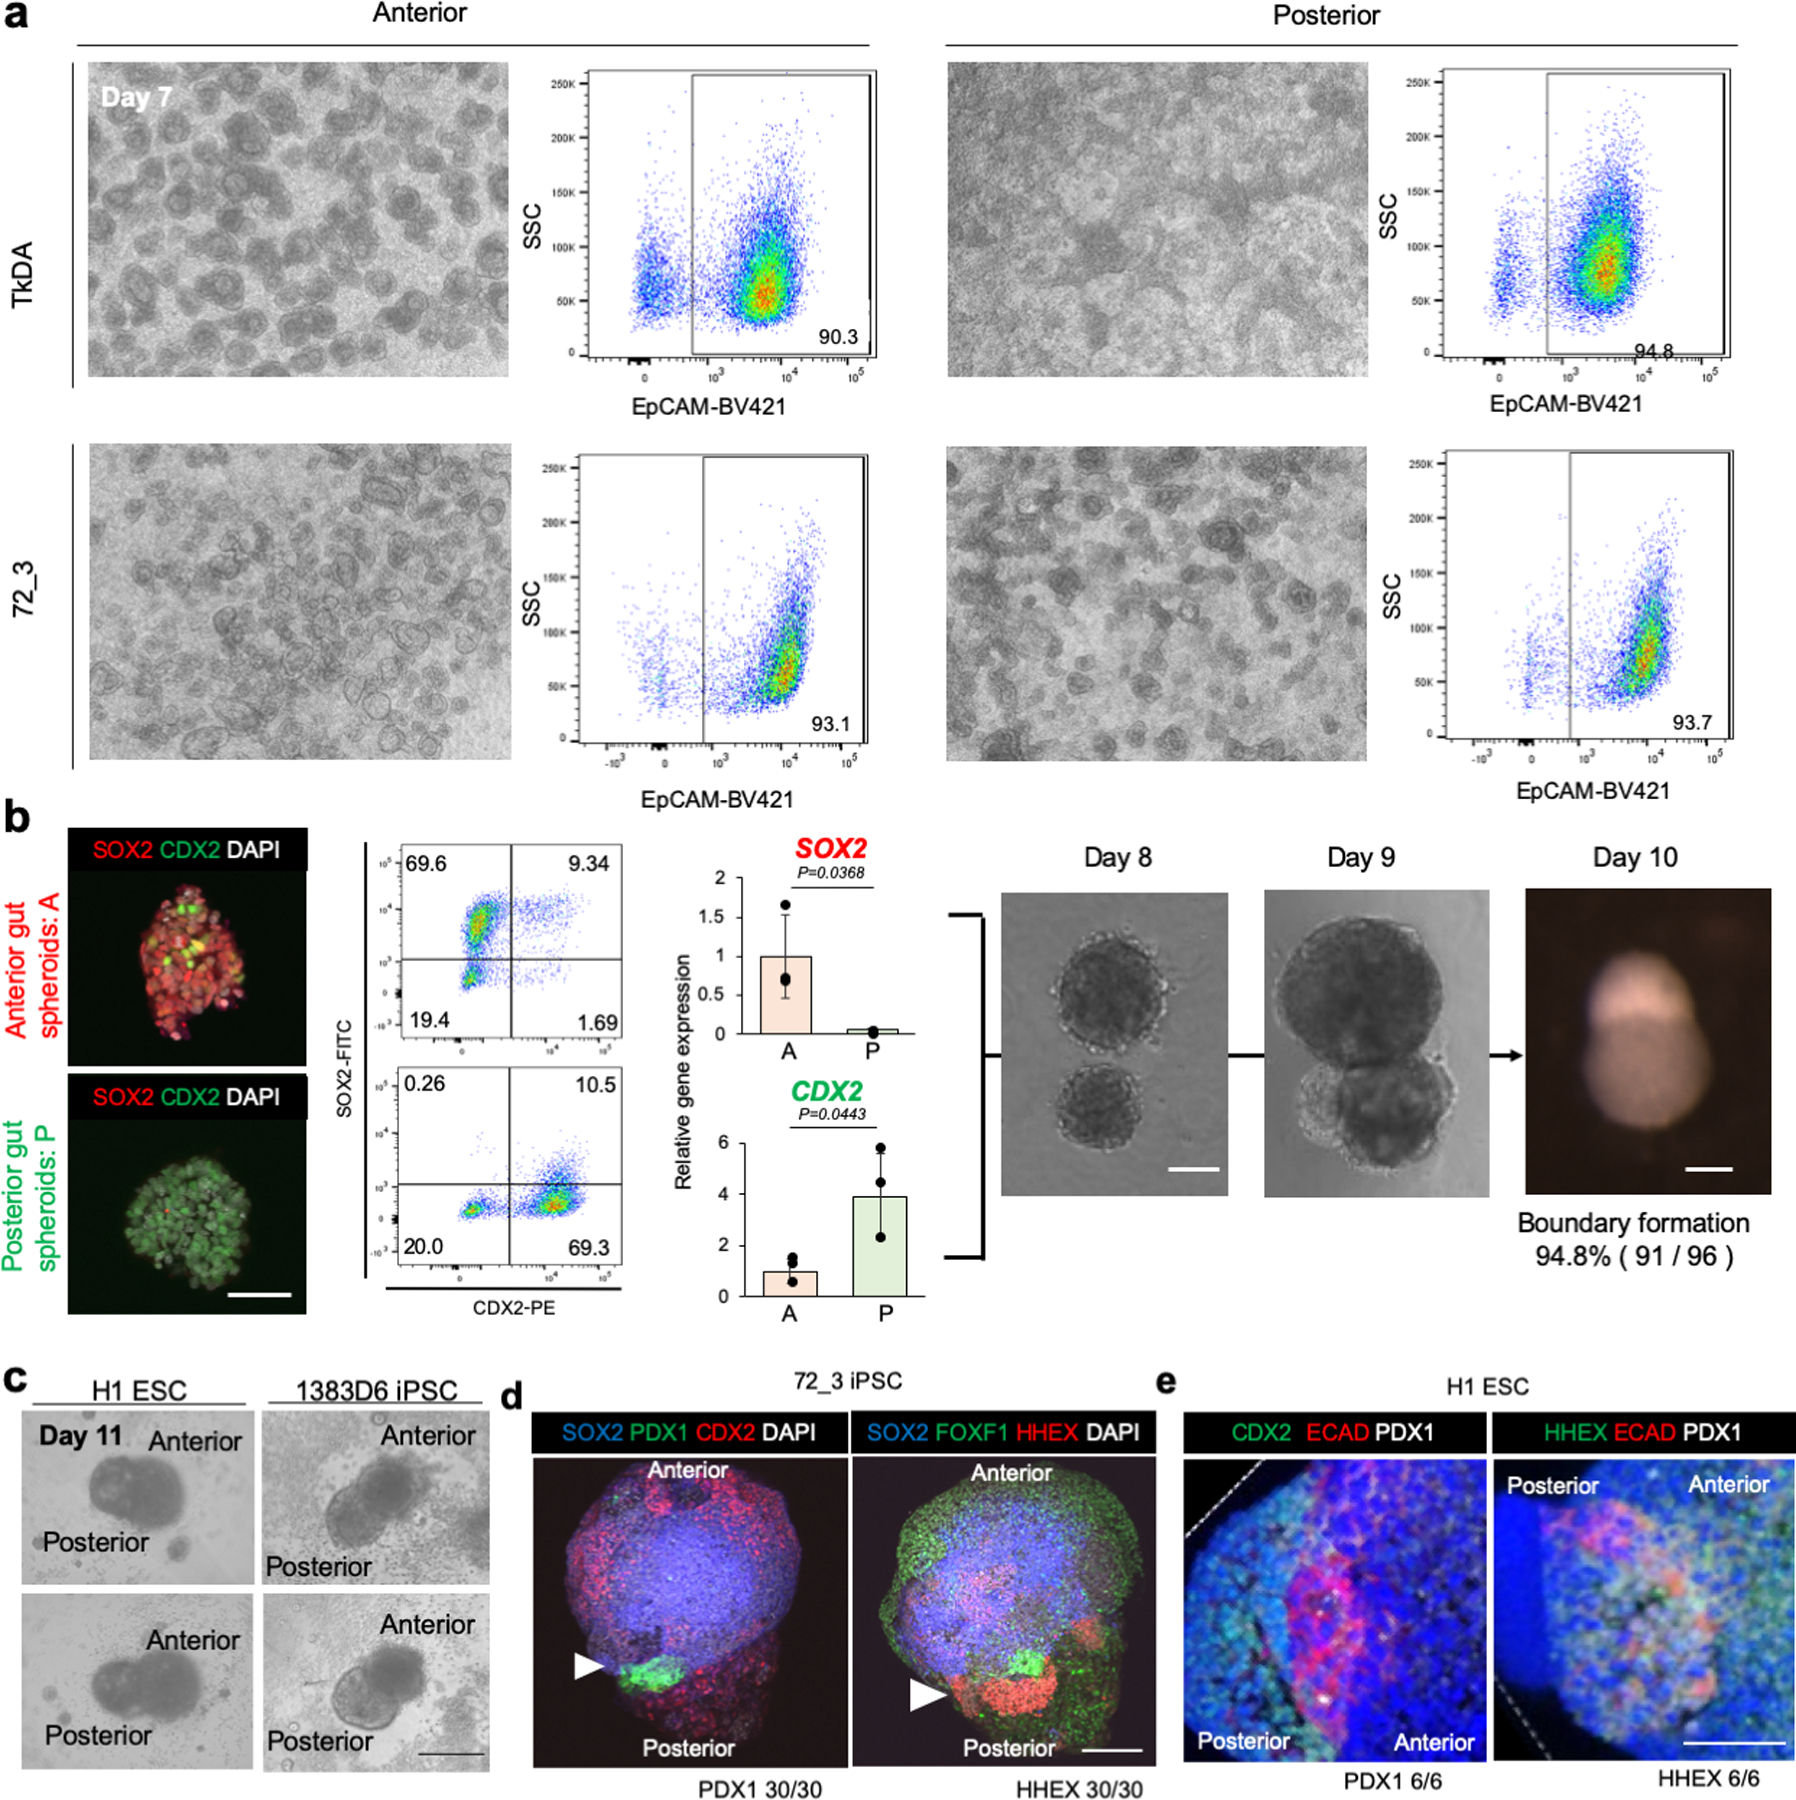
Extended Data Fig. 1: Anterior and posterior gut cell specification and boundary organoid formation.

a. Flow cytometry of EpCAM in day 7 anterior and posterior gut cells using TkDA human iPSCs and 72_3 human iPSCs. The gating strategy was FSC A / SSC A > FSC H / FSC W > SSC H / SSC W > PI / FSC A > EpCAM-BV421 / SSC A. Representative image of independent three experiments showing similar results.
b. Wholemount immunostaining, flowcytometry with percentage of each population showed in inlet, and qPCR for SOX2, CDX2, and organoid images of each time point. Data is mean ± s.d.; n =3 independent experiments. Unpaired, two-tailed t-test. Scale bars, 50 µm
c. The image of day 11 boundary organoids. Anterior and posterior gut spheroids were differentiated from H1 ESCs or 1383D6 iPSCs, mixed and transferred into Matrigel. Independent experiments repeated twice for each line with similar results. Scale bar is 200 μm.
d. Wholemount Immunofluorescent staining of PDX1, CDX2, FOXF1, and HHEX in boundary organoids derived from 72_3 iPSC at day 12. Representative image of n = 30 Independent organoids showing similar results. Arrowhead indicates boundary of organoid. Scale bar is 100 μm.
e. Wholemount immunofluorescent staining of CDX2, E-Cadherin, and HHEX in boundary region of boundary organoids derived from H1 ESC at day 12. Representative image of n = 6 Independent organoids showing similar results. Scale bar is 50 μm.
