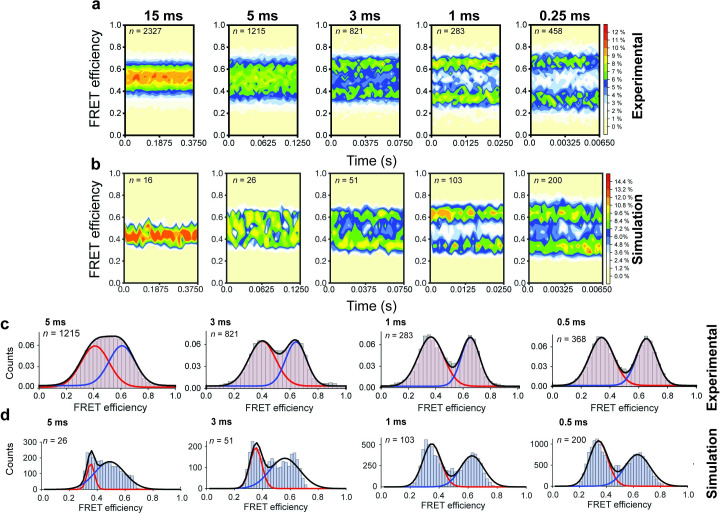
Fig 3. Population level correlation of smFRET and MD simulation FRET distributions.
(a) smFRET traces were summed into FRET-time contour plots to show the distribution of FRET populations at 15, 5, 3, 1, and 0.25 ms camera exposure times [70]. (b) Contour plots of MD simulations at the equivalent exposure times (to achieve required sampling for 15ms exposure, 7 simulation trajectories were combined into one trajectory). (c) Histograms of the smFRET experiments (bars) fitted to a two gaussian functions (lines) to identify distinct states with data obtained using TIRF imaging of immobilized particles [70]. (d) Histograms of MD simulations at the equivalent exposure times as smFRET experiments. At 5 and 3 ms sampling, a 3 Gaussian fit was used as an intermediate population between the two FRET states is observed.

