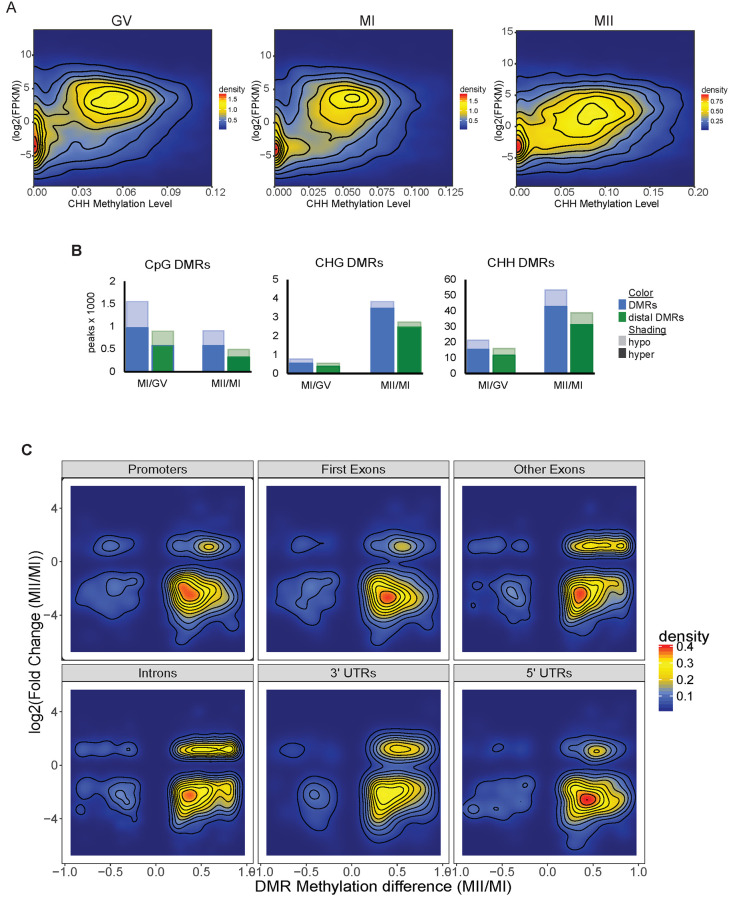
Fig 2. Gene body methylation and expression correlations.
A. Density plots of gene body methylation levels for CHH context and the corresponding gene’s expression level in GV, MI and MII oocytes. Density color scale to the right of each respective plot. B. Differentially methylated region (DMR) counts by the thousands for each C context in GV, MI and MII oocytes. Blue bar to the left is total DMR count. Green bar to the right is the count of distal DMRs. Hypermethylated DMRs are solid color while hypomethylated DMRs are lightly shaded. C. Methylation level of CHH DMRs in MI/MII comparison in specific genic regions and their corresponding gene expression level. Scale for density plot is to the right.

