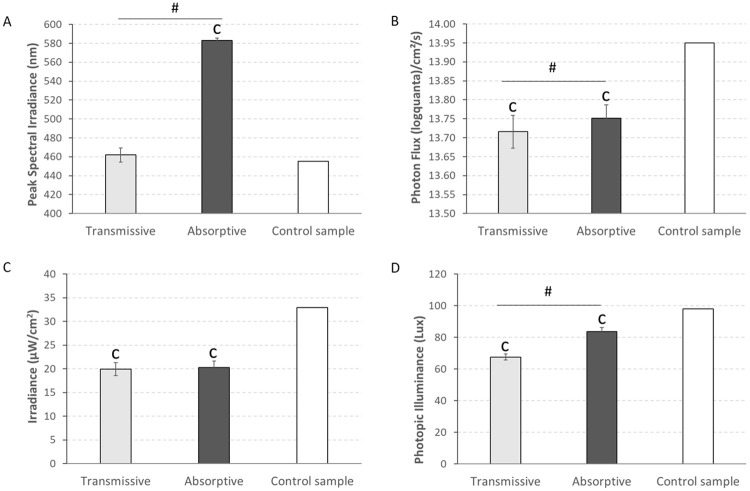
Fig 3. A) Peak of spectral irradiance, B) photon flux, C) irradiance and D) photopic illuminance of the light under transmissive (N = 11) and absorptive (N = 11) conditions as well as that for a control sample (N = 1).
Vertical bars indicate SEM.1-sample T-Test was used to compare both transmissive and absorptive states with the control sample and paired T-Test was performed to compare between both states. ‘c’ indicates significant differences with the control sample (1-sample T-Test, p < 0.001) while # indicates significant differences between transmissive and absorptive states (paired T-Test, p < 0.001).

