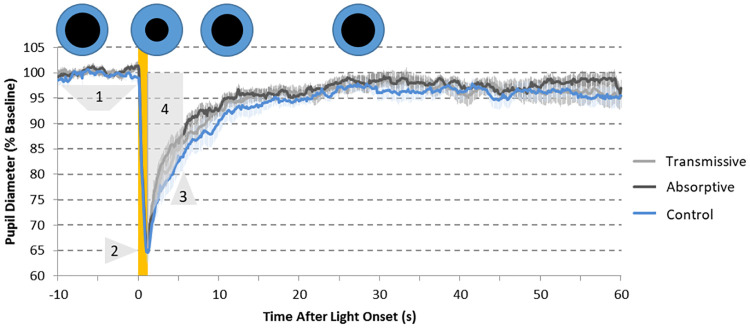
Fig 4. Pupillary light reflex (PLR) recordings (N = 16) under 1-s light stimulus filtered by the control sample (blue line, used as control), the ECF in a transmissive state (grey line) and the ECF in an absorptive state (black line).
The yellow area indicates the 1-second light stimuli. Pupil diameter is expressed as percentage of each recording baseline. Pale lines represent SEM. Parameters assessed for PLR. 1: Baseline (~100%); 2: Maximum constriction (% with respect to the baseline); 3: 6-s PIPR (% constriction 6 seconds after light stimulus); 4: area under the curve from 1 to 6 s after light onset (AUC1−6, yellow), expressed in A.U. Blue (iris) and black (pupil) circles qualitatively represent the evolution of the pupil size (black circles) during a standard PLR test.

