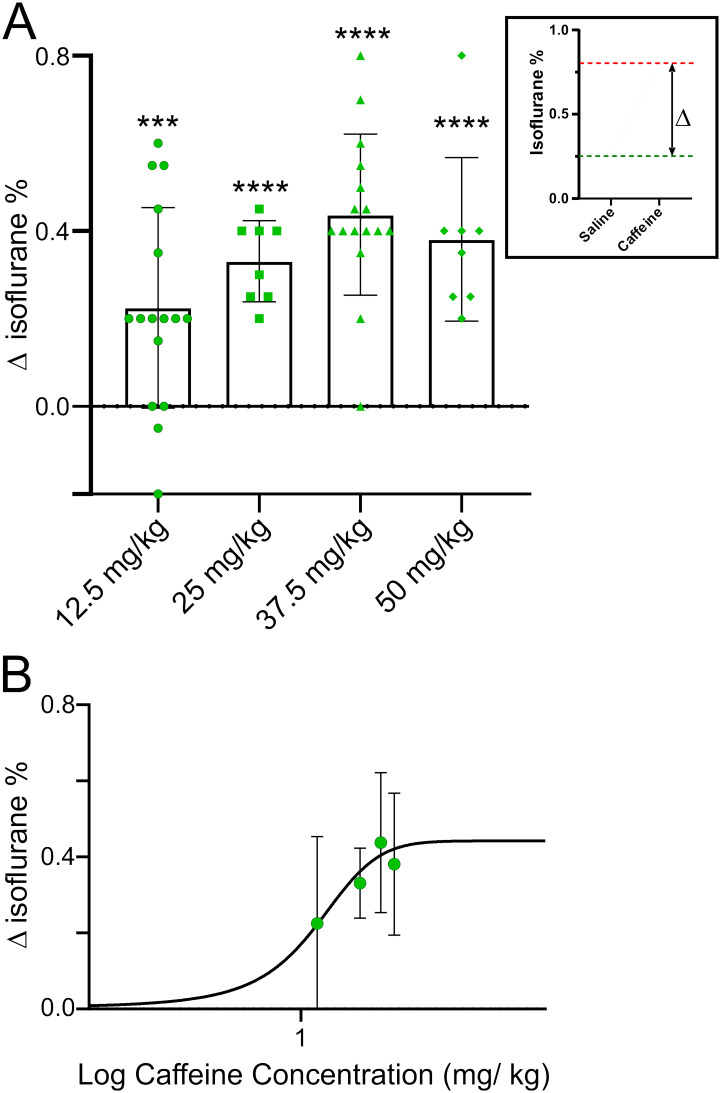
Fig 5. Dose-response relationship for recovery of righting reflex as a function of caffeine concentration.
The data from Fig 4 was used to construct this figure. A, inset shows data from a single rat infused with either saline or caffeine during different anesthesia sessions. This rat emerged from anesthesia at ~0.25% isoflurane when infused with saline (green line) and ~0.8% isoflurane when infused with caffeine (37.5 mg/kg) (red line). The Δ in the inset is the difference in the “waking” isoflurane concentration after caffeine compared to saline. The main figure plots Δ in emergence for the four different caffeine concentrations shown in Fig 4. B, A dose response curve was fit to the data shown in A. In this graph the slope of the curve was not constrained. The top of the curve was at a Δ isoflurane of 0.44% and the EC50 was at 12.42 mg/ kg caffeine.

