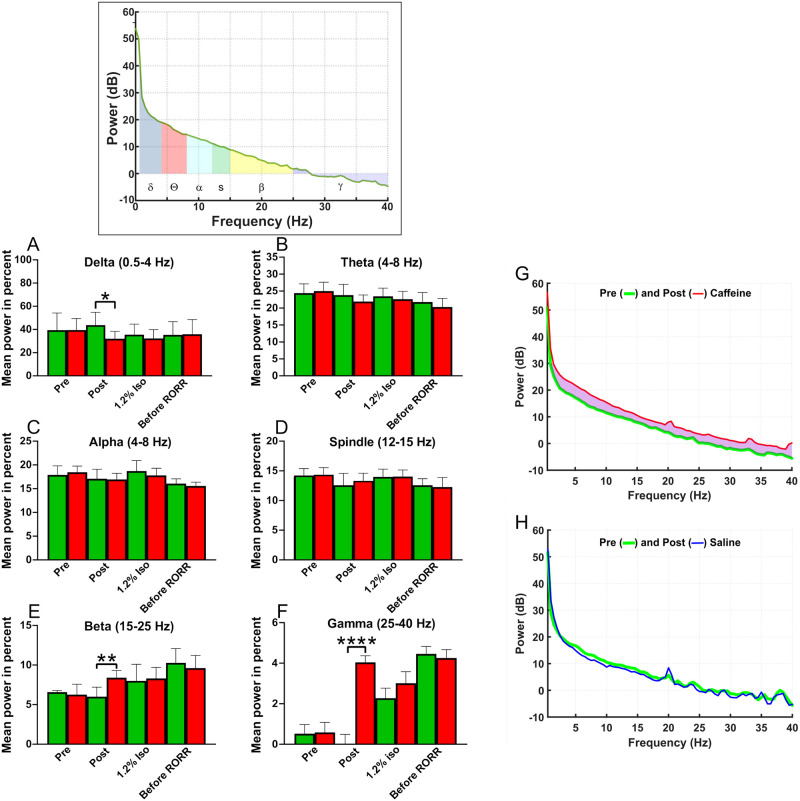
Fig 8. Caffeine’s effects were most apparent in high frequency bands of power spectra.
The inset plots a pre infusion power spectrum computed from a 2-minute epoch under 2% isoflurane (box at top of figure). Data from 2-minute epochs were divided into 512-point segments, analyzed and averaged. Each power spectrum was divided into component power bands as shown by the different colors and then analyzed. A-F) Data from 6 rats was averaged, with green bars from saline-infused (green) rats while red bars are from caffeine-infused (red) rats. Each rat was employed for both anesthesia sessions (caffeine and saline). Normalized power was calculated as the fraction of a specific frequency power, including delta (0.5–4 Hz), theta (4–8 Hz), alpha (8–12 Hz), spindle (12–15 Hz), beta (15–25 Hz) and gamma (25–40 Hz), divided by the total power over all frequency bands from 0.5–40 Hz. The normalized data was averaged between rats and then plotted as “Mean power in percent”. Power spectra were obtained from just before caffeine or saline infusion (pre), just after caffeine or saline infusion (post), during 1.2% isoflurane and before RORR. Comparisons were made between the saline and caffeine experiments at those 4 time periods. A repeated-measures ANOVA model was fit with condition (saline vs caffeine) and time as repeated factors. The normalized delta, beta and gamma bands between saline and caffeine experiment at the post infusion point were significant at *p<0.05 for delta, **p<0.01 for beta, ****p<0.0001 for gamma (n = 6). Theta, alpha and spindle bands did not reach significant difference between saline and caffeine experiments at any time points. G-H plot averaged power spectra from six rats, before (green line) and after caffeine infusion (red line) in caffeine session (G), or before (green line) and after saline infusion (blue line) in saline session (H), during 2% isoflurane. Saline did not alter the power spectrum in any measurable manner, while caffeine altered power at different frequencies, as indicated by the light purple shaded area between the green and red lines. This change in the power spectrum was transient and disappeared within 5 minutes.

