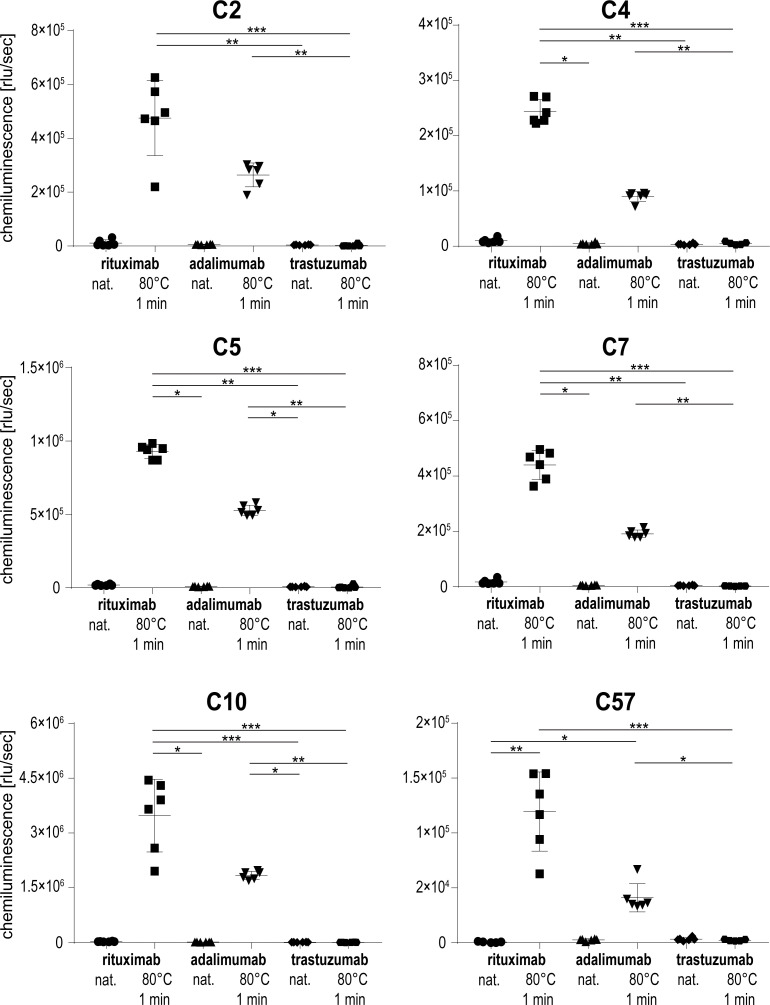
Fig 7. Aptamer binding behavior with other IgG1 antibodies.
Shown are the means and standard deviations of six replicates per sample and aptamer. A non-parametric test was performed, comparing all samples to each other, with corrections for multiple comparisons according to Dunn (*, p ≤ 0.05; **, p ≤ 0.01; ***, p ≤ 0.001).

