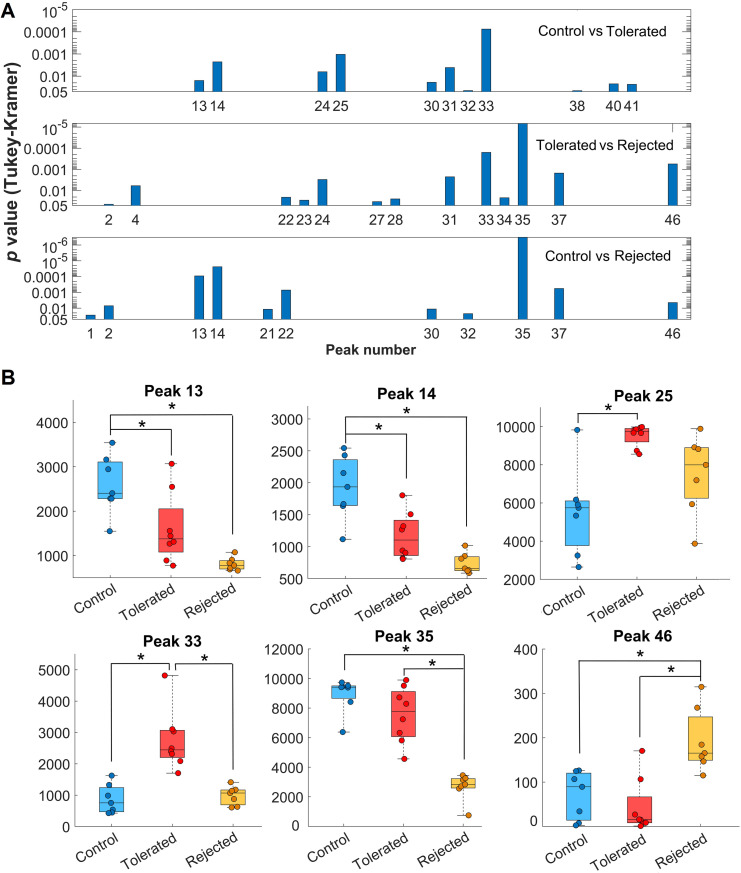
Fig 6. Several peaks in the electropherograms were identified with significant differences among the control, rejected and tolerated sample categories.
(A) Distribution of p values from Tukey-Kramer post-hoc test comparing the indicated peaks in the electropherograms (EPG) obtained in the pairwise comparisons of control (n = 7), tolerated (n = 8), and rejected (n = 7) sample categories. The higher the bar the lower the probability of the null hypothesis that there was no difference between the heights of the compared peaks. (B) Height values of the peaks with the highest significance when comparing the EPGs obtained in the three sample categories. Data are shown as box and whiskers plots indicating the medians (horizontal lines inside each box) and the upper and lower quartiles with all data points shown as round symbols. Asterisks indicate significant differences (*p<0.00001).

