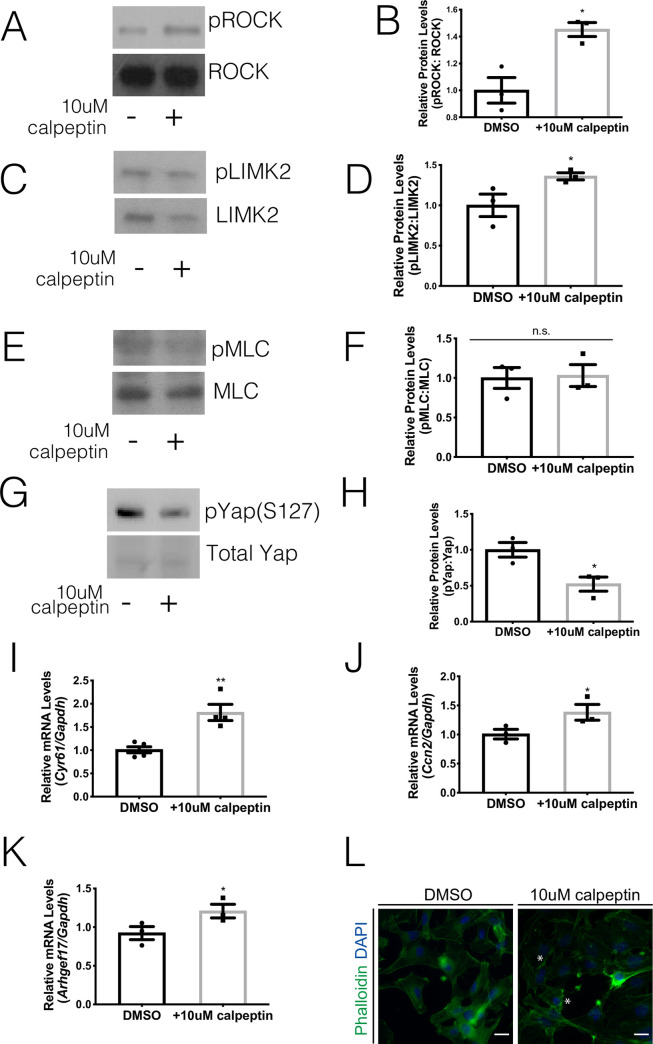
Fig 3. Activation of ROCK leads to Yap transcriptional activity.
Parotid salivary glands from FVB mice were dissected and cultured as primary acinar cell cultures. At sub-confluency, the cells were treated 10 μM calpeptin (ROCK activator) or DMSO vehicle control for two hours. (A) Levels of phosphorylated ROCK were determined by immunoblot following calpeptin treatment. Immunoblots were reprobed for total ROCK as a loading control. (B) Quantification of A. (C) Levels of phosphorylated LIMK2 were determined by immunoblot following calpeptin treatment. Immunoblots were reprobed for total LIMK2 as a loading control. (D) Quantification of C. (E) Levels of phosphorylated MLC were determined by immunoblot following calpeptin treatment. Immunoblots were reprobed for total MLC as a loading control. (F) Quantification of E. (G) Levels of phosphorylated Yap on serine 127 (pYAP S127) were determined following calpeptin treatment. Immunoblots were reprobed for total Yap as a loading control. (H) Quantification of G. (E) Relative mRNA levels of Cyr61 (I), Ccn2 (J) and Arhgef17 (K) were determined by qRT-PCR and normalized to Gapdh. (L) Immunofluorescent staining with Phalloidin (green) was used to visualize F-actin structures after calpeptin treatment. Indications of F-actin fragmentation are noted with asterisks (scale bar for magnification = 20 μm). Results are presented from at least three independent in vitro primary cell culture experiments per condition (each data point graphed in B, D, F, and H-K represents an independent cell preparation); error bars denote mean ± SEM. Significant difference (p<0.05) between vehicle control and inhibitor treated cells was determined by Student’s t-test.

