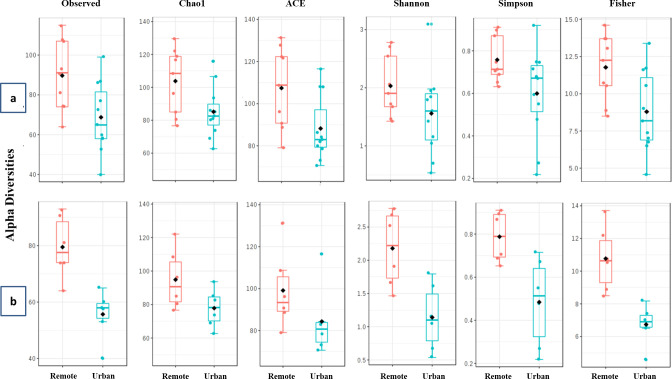
Fig 3.
Alpha diversity plots of (a) Bacterial and (b) Fungal communities. Students T-test was employed for comparisons when the experimental factor was sample collection site. Observed alpha diversity estimates are based on unique taxa richness or counts in each sample; Chao1 and ACE diversities are based on low abundance taxa richness; Shannon, Simpson and Fisher estimates are based on both taxa evenness (distribution) as well as richness.

