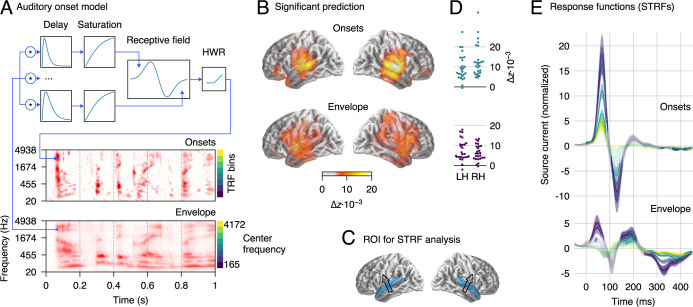
Fig 2. MEG responses to clean speech.
(A) Schematic illustration of the neurally inspired acoustic edge detector model, which was used to generate onset representations. The signal at each frequency band was passed through multiple parallel pathways with increasing delays, so that an “edge detector” receptive field could detect changes over time. HWR removed the negative sections to yield onsets only. An excerpt from a gammatone spectrogram (“envelope”) and the corresponding onset representation are shown for illustration. (B) Regions of significant explanatory power of onset and envelope representations, determined by comparing the cross-validated model fit from the combined model (envelopes + onsets) to that when omitting the relevant predictor. Results are consistent with sources in bilateral auditory cortex (p ≤ 0.05, corrected for whole brain analysis). (C) ROI used for the analysis of response functions, including superior temporal gyrus and Heschl’s gyrus. An arrow indicates the average dominant current direction in the ROI (upward current), determined through the first principal component of response power. (D) Individual subject data corresponding to (B), averaged over the ROI in the LH and RH, respectively. (E) STRFs corresponding to onset and envelope representations in the ROI; the onset STRF exhibits a clear pair of positive and negative peaks, while peaks in the envelope STRF are less well-defined. Different color curves reflect the frequency bins, as indicated next to the onset and envelope spectrograms in panel A. Shaded areas indicate the within-subject standard error (SE) [31]. Regions in which STRFs differ significantly from 0 are marked with more saturated (less faded) colors (p ≤ 0.05, corrected for time/frequency). Data are available in S1 Data. HWR, half-wave rectification; LH, left hemisphere; MEG, magnetoencephalographic; RH, right hemisphere; ROI, region of interest; SE, standard error; STRF, spectrotemporal response function; TRF, temporal response function.

