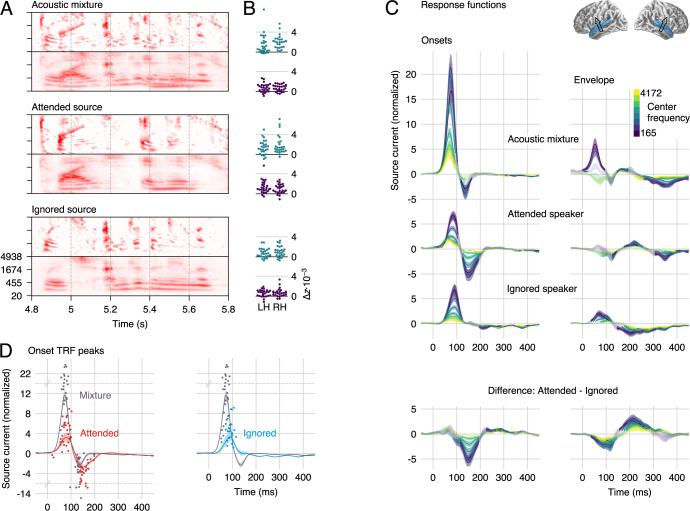
Fig 3. Responses to the 2-speaker mixture, using the stream-based model.
(A) The envelope and onset representations of the acoustic mixture and the 2 speech sources were used to predict MEG responses. (B) Individual subject model fit improvement due to each predictor, averaged in the auditory cortex ROI. Each predictor explains neural data not accounted for by the others. (C) Auditory cortex STRFs to onsets are characterized by the same positive/negative peak structure as STRFs to a single speaker. The early, positive peak is dominated by the mixture but also contains speaker-specific information. The second, negative peak is dominated by representations of the attended speaker and, to a lesser extent, the mixture. As with responses to a single talker, the envelope STRFs have lower amplitudes, but they do show a strong and well-defined effect of attention. Explicit differences between the attended and ignored representations are shown in the bottom row. Details as in Fig 2. (D) The major onset STRF peaks representing individual speech sources are delayed compared with corresponding peaks representing the mixture. To determine latencies, mixture-based and individual-speaker-based STRFs were averaged across frequency (lines with shading for mean ±1 SE). Dots represent the largest positive and negative peak for each subject between 20 and 200 milliseconds. Note that the y-axis is scaled by an extra factor of 4 beyond the indicated break points at y = 14 and −6. Data are available in S2 Data. LH, left hemisphere; MEG, magnetoencephalography; RH, right hemisphere; ROI, region of interest; SE, standard error; STRF, spectrotemporal response function.

