Fig 1.
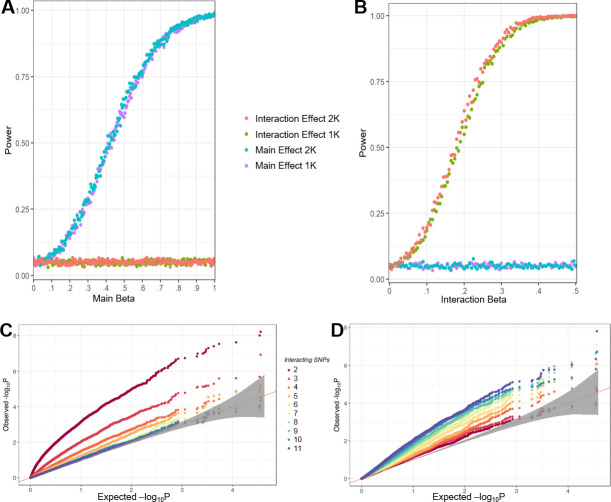
Simulation results A+B) Power calculations based on simulated data with variable main SNP effects βG (A) or variable Ancestry-SNP effects βGxθ (B). Blue and Purple power curves are the power curves for detecting a significant SNP effect, while the orange and green curves are the power curves for detecting a significant Gxθ effect. Two phenotypic models, one incorporating 1 GRM (1K) correcting for relatedness in the SNPs (green, purple) and one incorporating 2 GRMs (2K) correcting for relatedness in both SNPs and Ancestry (red, blue) were used. (C+D) Effect of increasing numbers of epistatically interacting SNPs on the algorithms ability to detect a significant main SNP effect (C) or Gxθ effect (D). The straight line in C and D represents the line where expected and observed P values are the same, while the grey band indicates the 95% confidence interval in which the observed P-value distribution cannot be distinguished from the expected P-value distribution.

