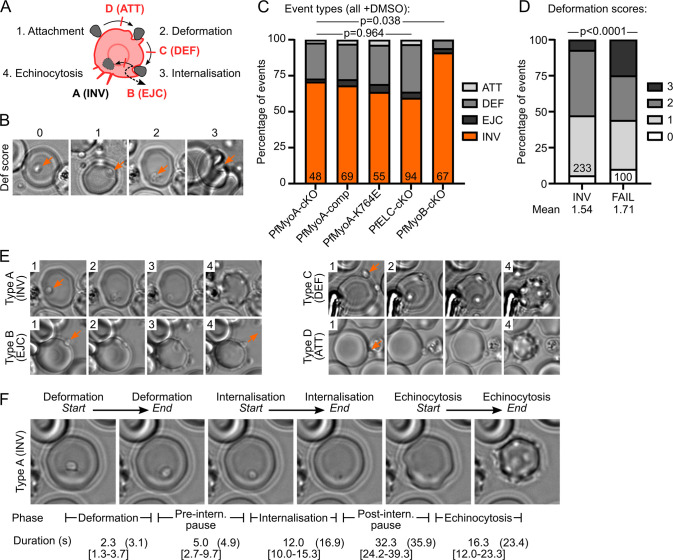
Fig 4. Video microscopy of merozoite invasion.
A Schematic of merozoite invasion. Invasion comprises attachment to the RBC, deformation of the RBC membrane, internalisation of the merozoite and RBC echinocytosis. Invasion attempts are classified as successful (Type A) or by the phase of failure (Type B-D). B Each event was assigned a score based on the intensity of RBC deformation, from 0 (no deformation) to 3 (severe deformation). C Event types in videos from each line after DMSO treatment. While the distribution of events is not significantly different in PfMyoA or PfELC-cKO lines, PfMyoB-cKO shows significantly more successful invasion. Videos pooled from two independent experiments, each in duplicate. Numbers indicate total videos, each video corresponds to one merozoite invading one RBC (or the first merozoite if multiple invaded the same RBC). Significance assessed by chi-square test, either each PfMyoA/PfELC line separately, or PfMyoB-cKO vs others pooled. D Deformation scores from all DMSO-treated lines separated by successful invasion (INV) or any type of failure (FAIL) reveal a significant increase in strong deformation in failed events. Numbers indicate total videos. Significance assessed by chi-square test. E Examples of each event type, with the numbers indicating the phase of invasion shown in that image (numbers from A). (For Type B event, see S3 Video; for Type D event, see S1 Video). F For Type A and Type B events, the start and end of deformation, internalisation and echinocytosis were timed, leading to the five intervals shown. The median times from Type A events across all lines after DMSO treatment is shown [interquartile range in square brackets], with overall agreement to published values ([8] in brackets).

