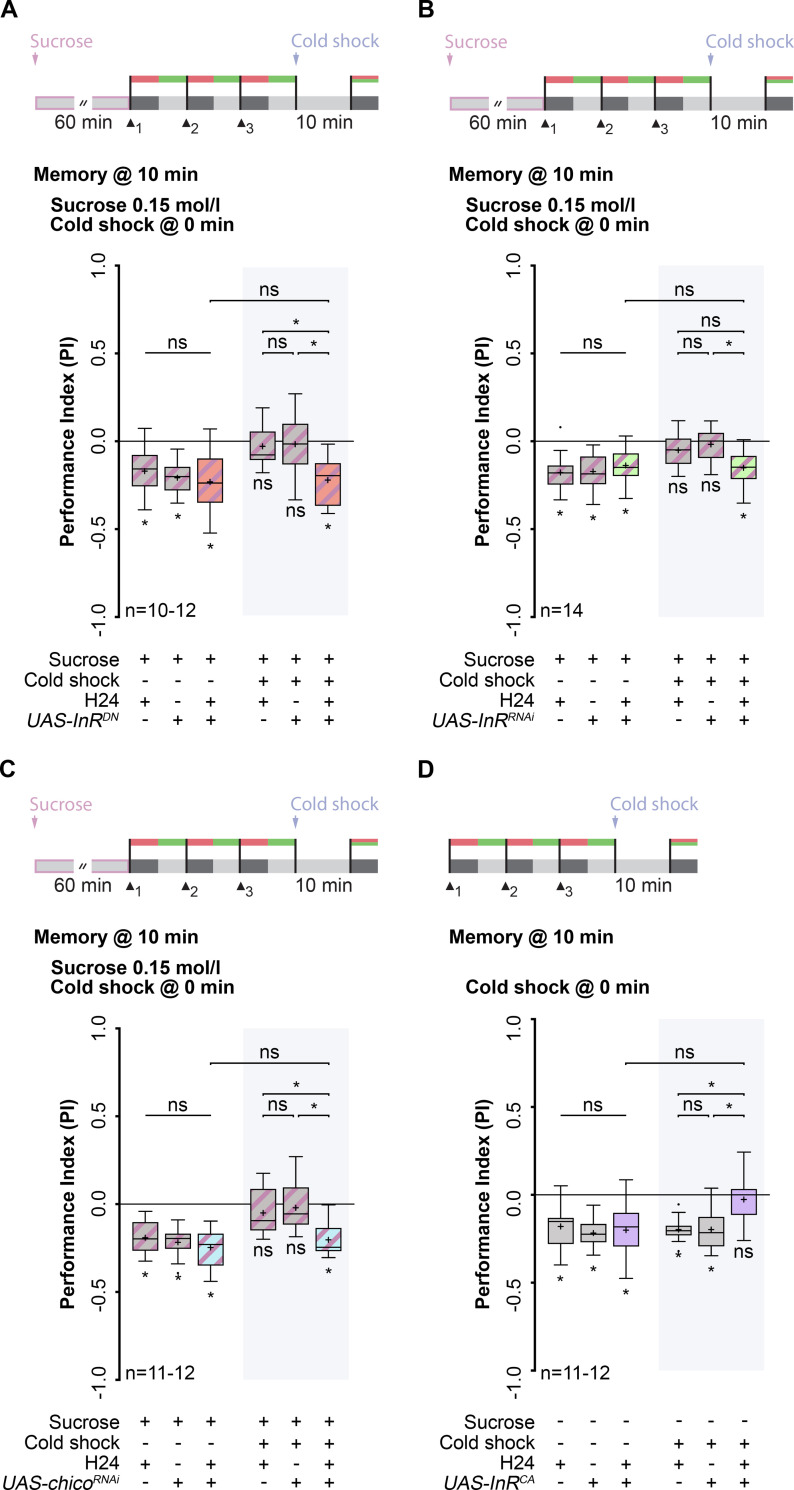
Fig 3. Activity of the insulin receptor is necessary for suppression of lARM after sucrose consumption.
(A) Top: Training and treatment protocols. All groups consumed sucrose for 60 min and identification of lARM was carried out by applying a cold shock directly after training. Memory was tested 10 min after training. Bottom: Expression of a dominant negative form of the insulin receptor (UAS-InRDN) in KCs using the driver line H24 prevents the suppression of lARM formation triggered by sucrose consumption. (B) Top: Training and treatment protocols. All groups consumed sucrose for 60 min and identification of lARM was carried out by applying a cold shock directly after training. Memory was tested 10 min after training. Bottom: Knockdown of the insulin receptor by driving expression of UAS-InRRNAi via H24 prevents the suppression of lARM formation triggered by sucrose consumption. (C) Top: Training and treatment protocols. All groups consumed sucrose for 60 min and identification of lARM was carried out by applying a cold shock directly after training. Memory was tested 10 min after training. Bottom: Knockdown of the insulin receptor substrate (IRS) by driving expression of UAS-chicoRNAi via H24 prevents the suppression of lARM formation triggered by sucrose consumption. (D) Top: Training and treatment protocols. Identification of lARM was carried out by applying a cold shock directly after training. Memory was tested 10 min after training. Bottom: Expression of a constitutively active form of the insulin receptor (UAS-InRCA) in KCs using the driver line H24 leads to the formation of a cold shock sensitive memory since larvae showed a complete loss of memory. Memory performance above the level of chance was tested using Bonferroni-corrected one-sample t-tests (ns p≥0.05/6; * p<0.05/6; adjusted significance level α). Differences between the groups were determined using two-way ANOVA followed by Bonferroni post-hoc pairwise comparisons and are depicted above the respective box plots (ns p≥0.05; * p<0.05). For more statistical details see also S1 Table and S3 Table. Data are shown as Tukey box plots; line, median; cross, mean; box, 75th-25th percentiles; whiskers, 1.5 interquartile range; small circles, outlier (n≥8).

