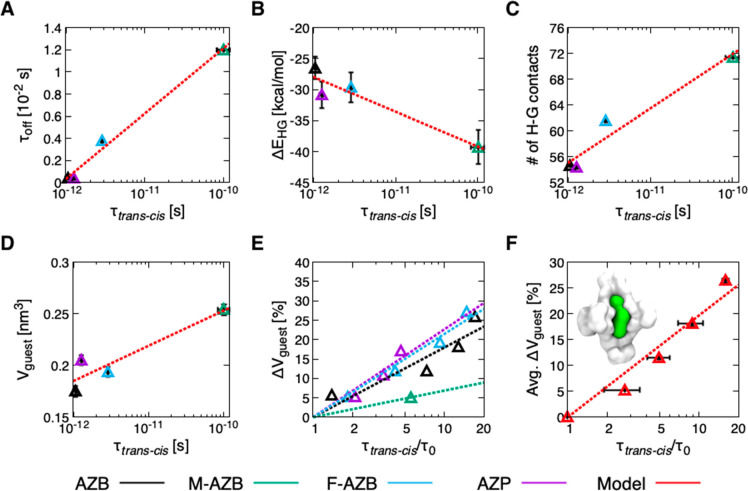
Figure 6.
Molecular determinants of isomerization under confinement. (A) Relationship between isomerization rate (τtrans–cis) and residence times (τoff) of the guests inside the cage. (B) Relationship between τtrans–cis and potential energy of host–guest interactions, ΔEHG. (C) Relationship between τtrans–cis and the number of contacts between the cage and the guest. (D) Relationship between τtrans–cis and the volume (V) of guest molecules (see the SI Methods section for details on guest volume estimation). (E) Switching deceleration, τtrans–cis/τ0, as a function of the increase in guest volume (%ΔVguest), in which τ0 denotes isomerization time measured at the original volume of each guest. In plots A–E, the points correspond to guests AZB (black), M-AZB (green), F-AZB (cyan), and AZP (violet). (F) Average τtrans–cis/τ0 as a function of the average increase in guest volume (%ΔVguest), obtained by averaging all data from plot E between systems with similar %ΔVguest. The error bars indicate the standard deviation of %ΔVguest and τtrans–cis/τ0 values. Inset: cartoon showing the volume of encapsulated M-AZB (green) inside the cage (white). The dashed lines in all plots are the logarithmic fit of the data.

