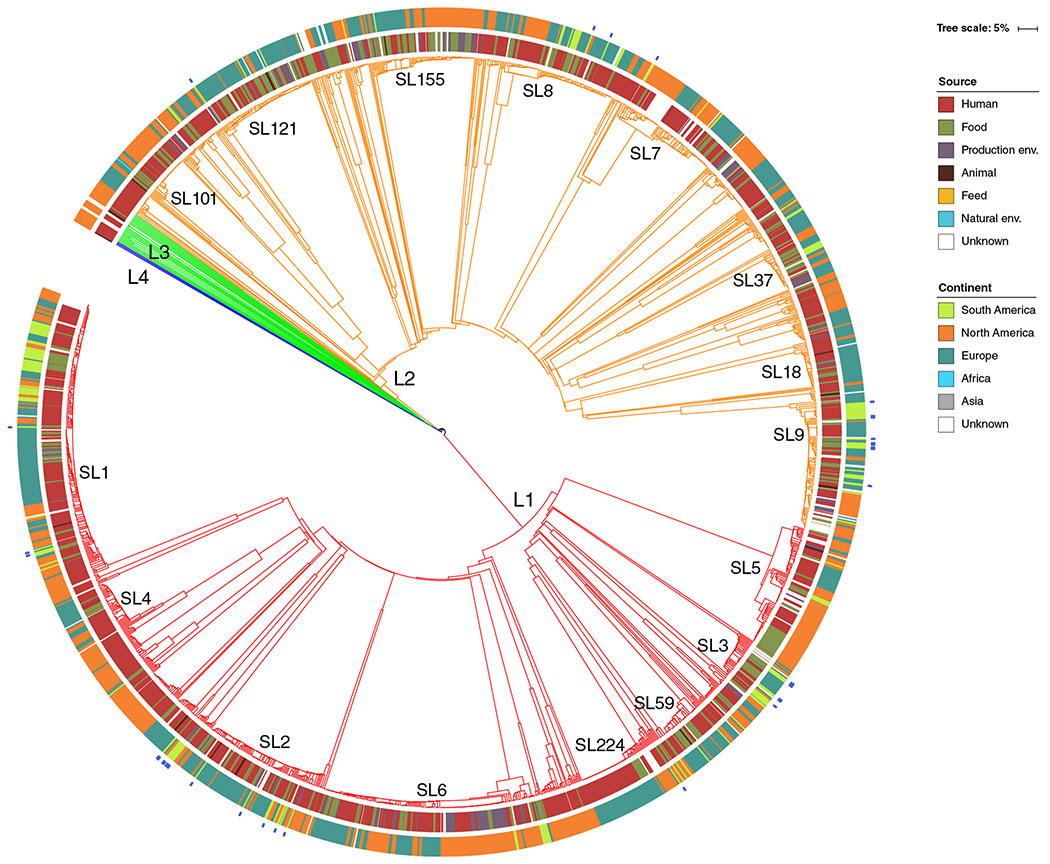
Fig. 3.
Phylogenetic placement of the 35 isolates included in this study together with the worldwide collection of 1696 genomes (Moura et al., 2016) and 113 additional genomes from South America retrieved from NCBI database (last accessed 01-10-2018). The dendrogram was obtained using the single-linkage method on the cgMLST allelic profiles of the 1844 isolates. Branches are coloured by phylogenetic lineage (L1, red; L2, orange; L3, green; L4, blue). SLs with more than 30 isolates are labelled in the tree. Inner rings show the isolate’s source type and geographic location, according to the colour codes shown on the left. Isolates from this study are marked in blue in the most external ring. [Color figure can be viewed at wileyonlinelibrary.com]

