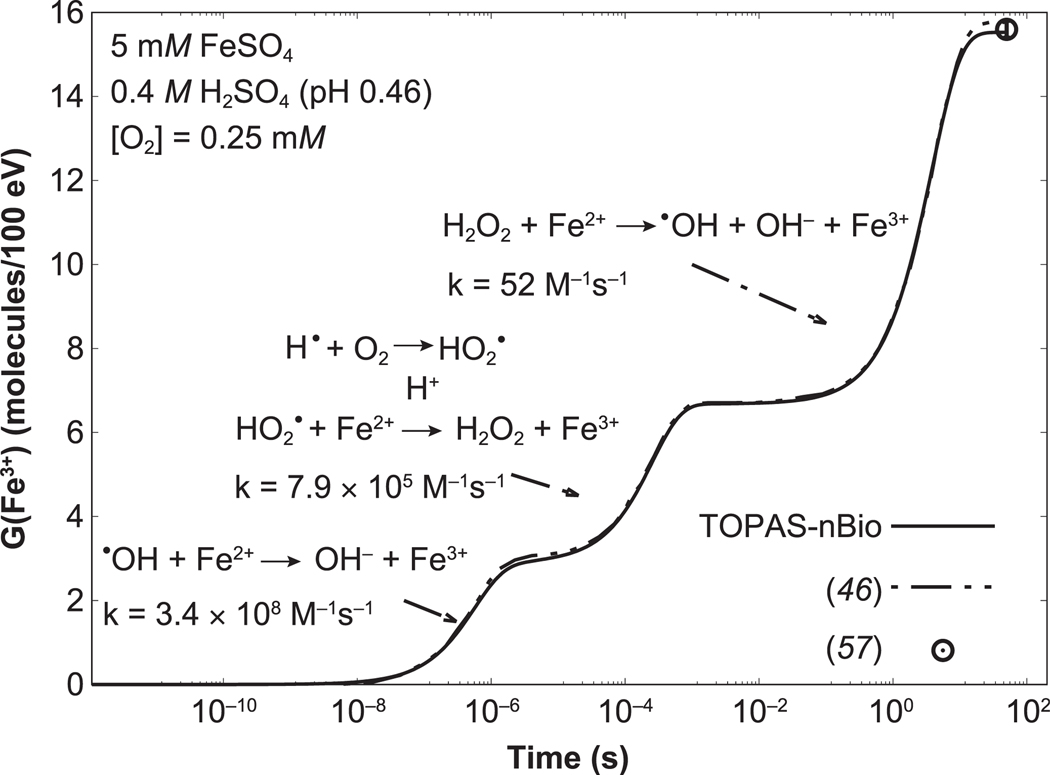
FIG. 1.
Time evolution of the G value of Fe3+ from 60Co irradiation of a Fricke solution, calculated using TOPAS-nBio (solid line). The reactions between •OH, HO2•, and H2O2 with Fe2+ that leads to Fe3+, and their reaction rate coefficients, are also shown. The arrows indicate the time stages when these reactions contribute to the G value. Simulated data from Plante (46) and accepted measured value from ICRU Report 34 (57) for 60Co are shown as the dot-dashed line and the open circle, respectively.

