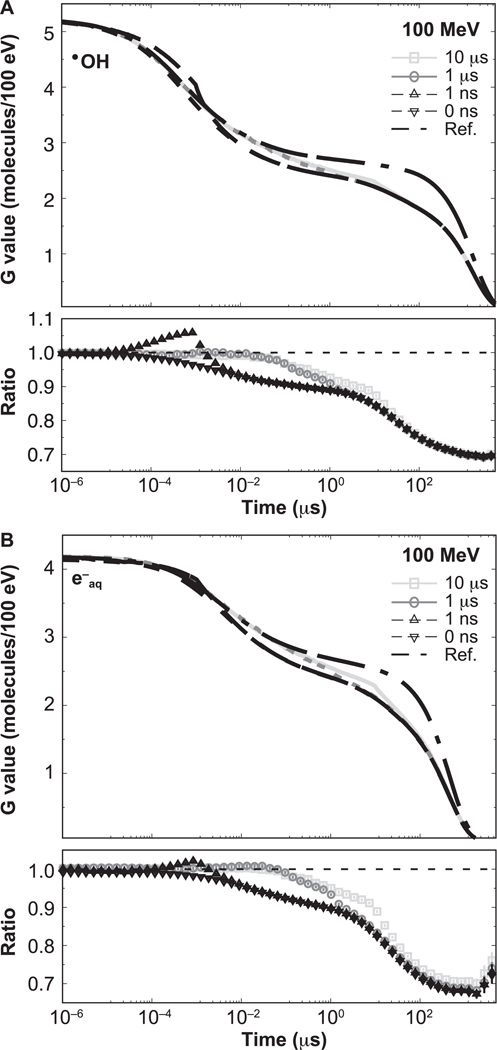
FIG. 4.
Time-dependent G values from proton tracks of 100 MeV delivering a dose of 50 cGy with different pulse widths: 0 ns, 1 ns, 1 μs and 10 μs. Reference results are indicated by the dashed-dotted lines. Ratios with respect to the reference simulations are shown in the lower section of each panel. Error bars represent one standard deviation of the combined statistical uncertainty.

