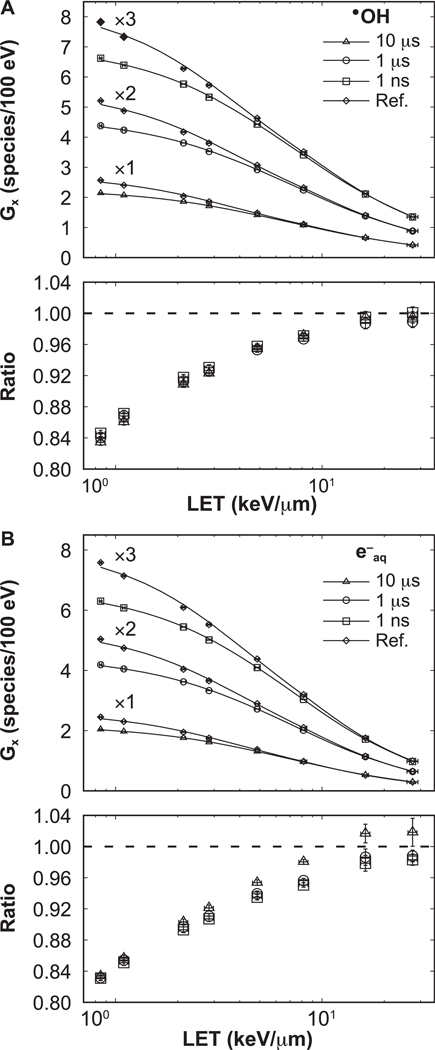
FIG. 6.
LET-dependent G values at t2 = W + 10 μs. The data for each option was scaled by factors of 1, 2, 3, as shown, for clarity. Connecting lines are added to guide the eye. Ratios with respect to the reference results are shown in the lower section of each panel. Ratios corresponding to 0 ns pulse width agreed within statistical uncertainty with results from 1 ns pulse width and, for clarity, are not displayed. Error bars represent one standard deviation of the combined statistical uncertainties.

