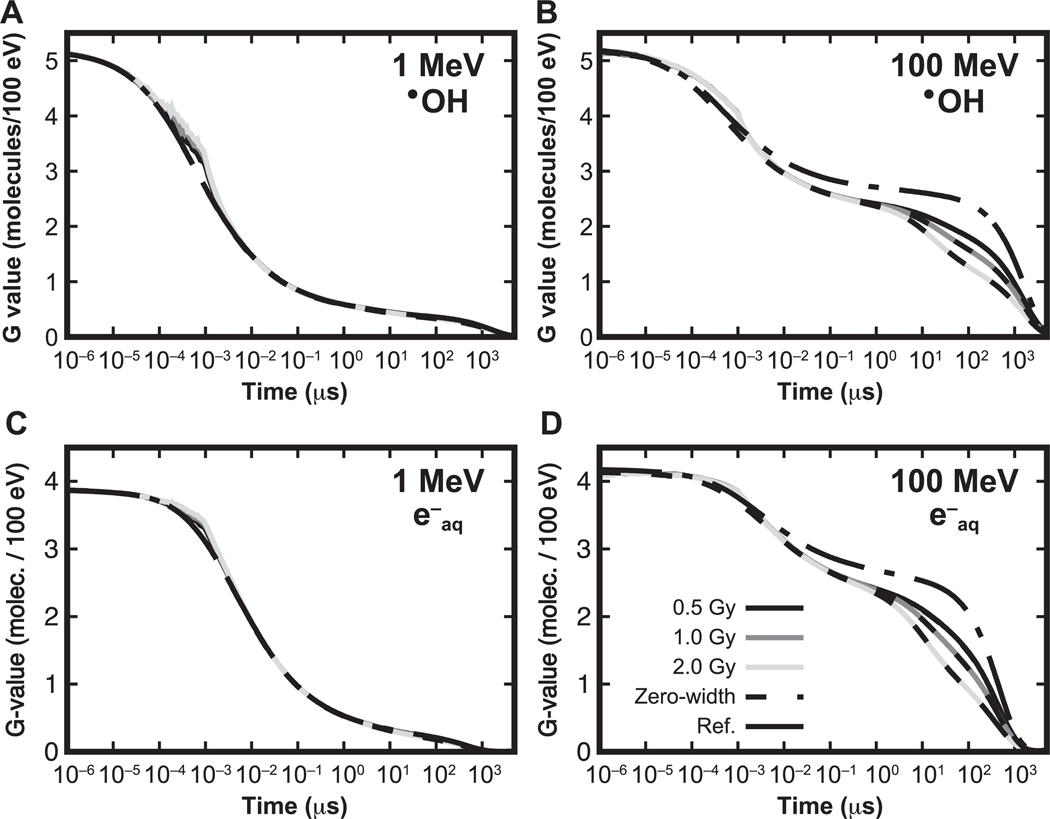
FIG. 8.
G values as a function of the time for •OH and produced by 1 MeV and 100 MeV. A dose of 0.5 Gy, 1.0 Gy and 2.0 Gy was simulated within a pulse of 1 ns. For each dose, the corresponding zero-width pulse simulations are indicated by dashed lines. Reference simulations at 0.5 Gy, with no intertrack effects, are indicated by dotted-dashed lines.

