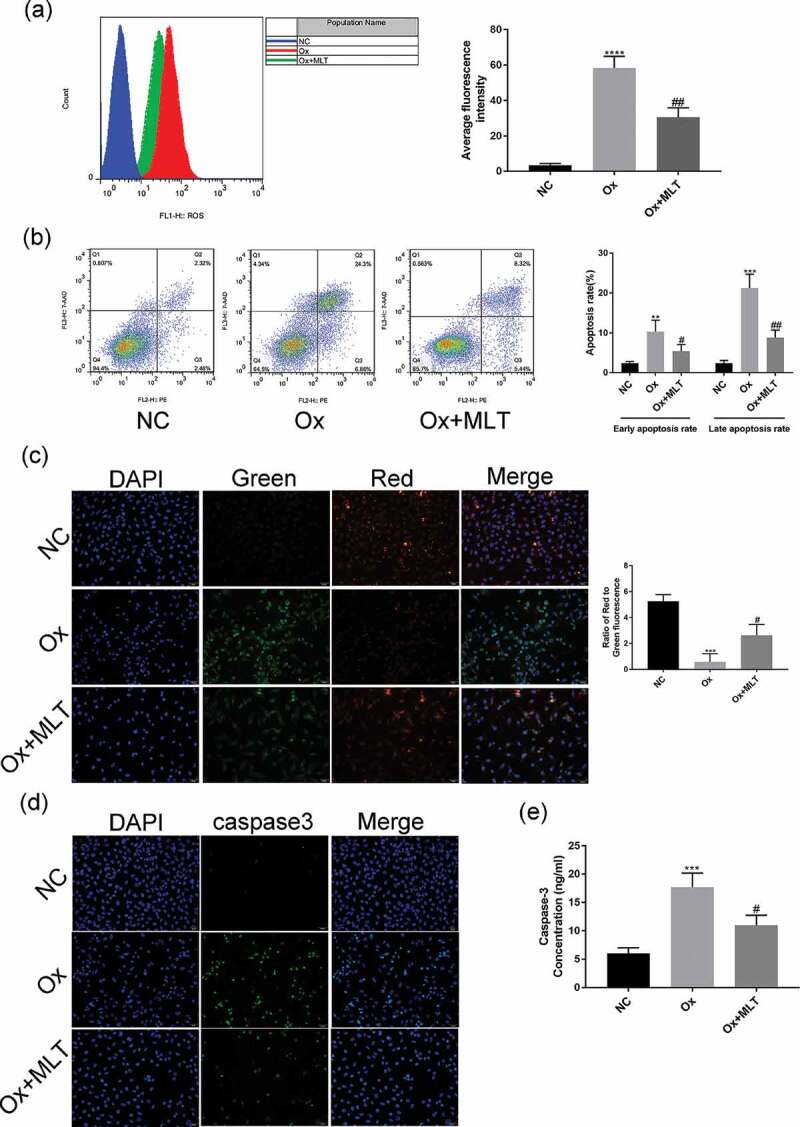
Figure 2.

Impact of melatonin on ROS production and apoptosis in HK-2 cells. Cells in the respective groups were treated for 12 h with 4 mmol/L Ox (except the NC group) and 10 μmol/L MLT (Ox + MLT group only). Flow cytometry profiles and corresponding histograms showing (a) ROS levels and (b) early and late apoptotic rate in three treatment groups. Immunofluorescence images showing (c) mitochondrial membrane potential and (d) caspase-3 activity (200× magnification), and (e) histogram of ELISA showing caspase-3 activity. The reduction in mitochondrial membrane potential (transition from red to green fluorescence) is a sign of early apoptosis. Stronger green fluorescence indicates higher caspase-3 activity. Data are presented as the means ± SEM from three independent experiments. *P < 0.05, **P < 0.01, ***P < 0.001,****P < 0.0001 versus the NC group; #P < 0.05, ##P < 0.01, ###P < 0.001, ####P < 0.0001 versus the Ox group
