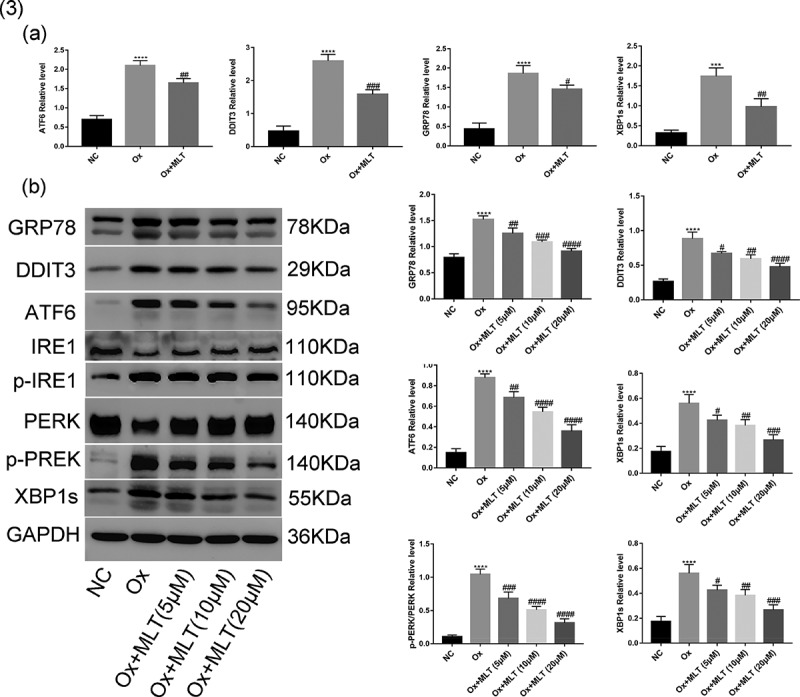
Figure 3.

Impact of melatonin on ER stress-related protein and mRNA levels. Cells in each group were treated for 12 h with 4 mmol/L Ox (except the NC group) and 10 μmol/L MLT (except NC and Ox groups). (a) RT-PCR histograms of mRNA levels of DDIT3, GRP78, ATF6, and XBP1s relative to GAPDH. (b) Western blot and corresponding histograms of DDIT3, GRP78, ATF6, PERK, p-PERK, IRE1, p-IRE1, and XBP1s protein expression relative to GAPDH. Data are presented as the mean ± SEM from three experiments. *P < 0.05, **P < 0.01, ***P < 0.001, ****P < 0.0001 versus the NC group; #P < 0.05, ##P < 0.01, ###P < 0.001, ####P < 0.0001 versus the Ox group
