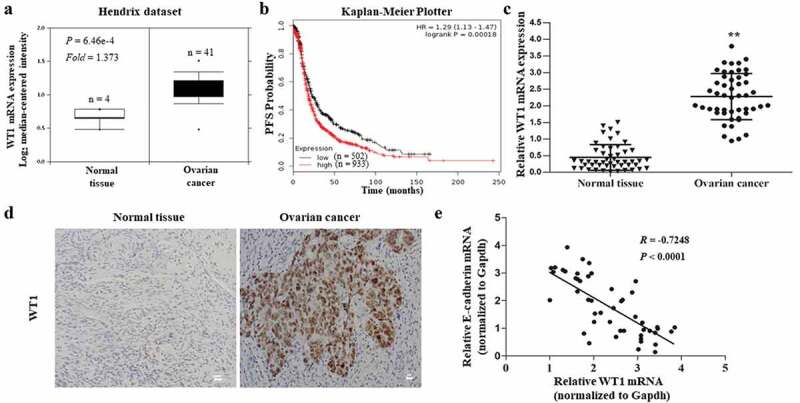
Figure 1.

Clinical significance of WT1 in human ovarian cancer. A, Box plots of WT1 mRNA levels in OC tissues and normal ovarian tissues in the Oncomine cancer microarray database. B, Kaplan-Meier curves of progression-free survival (PFS) probability in OC patients with high levels of WT1 expression (red) as compared to those with low WT1 expression levels (black). C, The mRNA expression of WT1 in OC tissues and their matched non-tumor counterparts in the 49 patients. ** P < 0.01. D, Representative images of immunohistochemistry staining for WT1 in OC tissues and their paired non-tumor tissues. Magnification x 10. Bar = 20 μm. E, A linear correlation study was performed between mRNA expression of WT1 vs. E-cadherin in OC tissues of the 49 patients
