
Figure 2.
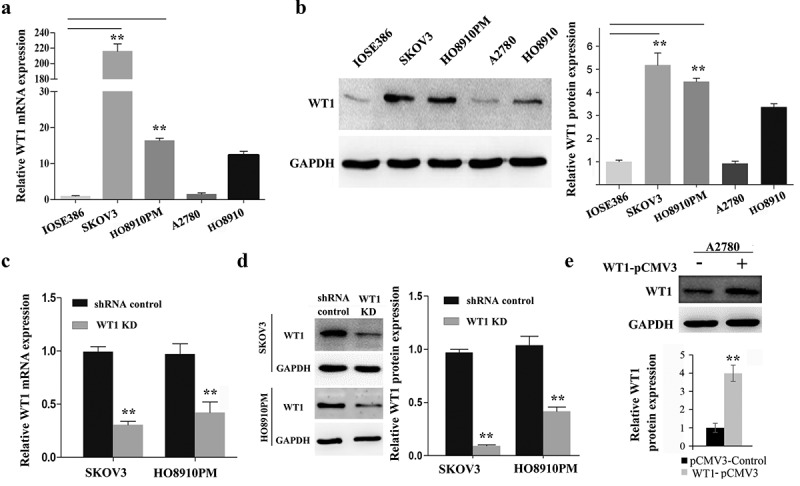
WT1 knockdown and overexpression in ovarian cancer cell lines. (a,b) WT1 expression in four ovarian cancer cell lines (SKOV3, A2780, HO8910, HO8910PM) and normal human ovarian cell line (IOSE386) was examined using qRT-PCR and western blot assay. GAPDH used as loading control. ** P < 0.01 represents difference in SKOV3 and HO8910PM cell lines compared with IOSE386, respectively. (c,d) The knockdown efficiency of WT1 was detected by qRT-PCR and western blotting in SKOV3 and HO8910PM cells. GAPDH served as loading control. (e) The overexpression efficiency of WT1 was examined by western blotting in A2780 cells. The graph on the right of figures B and D, or lower panel of figure E showed the quantification of the results. The data were presented as the mean ± SD from three experimental replicates. **P < 0.01 compared with the compared group