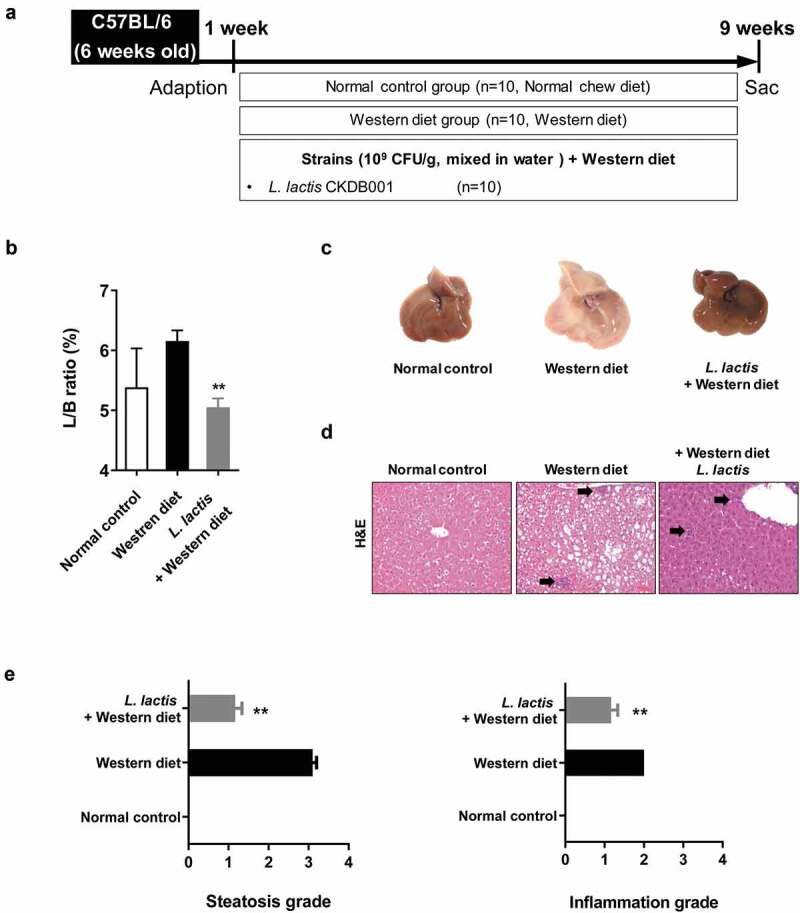
Figure 1.

Animal experiment results. (a) Flow chart of the animal experiment. (b) Liver/body weight ratio in mice. (c) Gross specimen of mice liver. (d) Pathological effects of L. lactis on the liver (Hematoxylin and Eosin stain). ×200 (e) Steatosis grade and (f) Inflammation grade. *p < 0.05, **p < 0.001
