. 2020 Oct 21;9:e59929. doi: 10.7554/eLife.59929

Figure 1. Summary of RNA-seq datasets.

(A) Number of reads mapped to expressed genes for each sample. To obtain a balanced set of 39 samples per species, the 10 samples outlined in gray were excluded from differential expression and variability analysis. Nine of these samples are among the lowest read count samples sourced from GTEx. The remaining sample was excluded on the basis of inspection of (B) unsupervised hierarchal clustering of RNA-seq samples by Pearson correlation matrix of expression log(CPM). (C) Principal component analysis shows samples separating by species along the first principal component. Only samples used in DE and variability analyses are shown in (C). Source data for (A) and other metadata for RNA-seq datasets used in this study are in Figure 1—source data 1.

Figure 1—source data 1. RNA-seq datasets used in this study.

Figure 1.

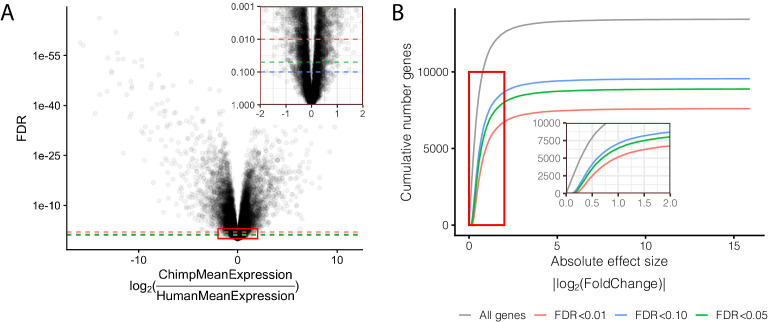
Figure 1—figure supplement 1. Effect size and significance of differential expression (DE) analysis.

Figure 1—figure supplement 1.

(A) Volcano plot of DE genes between human and chimpanzee heart tissue. Inset focuses on the red boxed area to highlight the relationship between expression fold change and DE gene classification at various FDR thresholds. (B) The number of DE genes identified under any given fold change threshold at various FDR thresholds. Full DE results are available in Figure 1—figure supplement 1—source data 1.
Figure 1—figure supplement 1—source data 1. Full DE results.

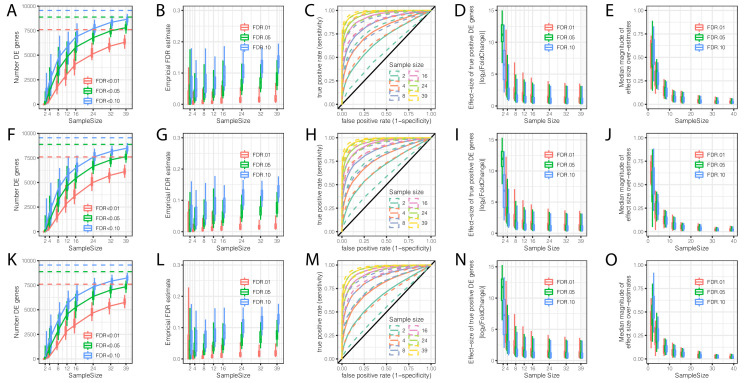
Figure 1—figure supplement 2. Evaluation of the contribution of sample size and read depth to differential expression analysis between chimpanzee and human.

Figure 1—figure supplement 2.

(A) The number of DE genes identified at varying thresholds after randomly subsampling (with replacement) the number of individuals in each species at the indicated sample size per species (hereafter referred to as a single bootstrap replicate). Dashed lines indicate the number of DE genes identified from the full dataset of 39 human and 39 chimpanzee individuals. Box-whisker plots depict quantiles among 100 bootstrap replicates. (B) An empirical estimate of FDR was obtained by calculating the fraction of DE genes in each subsample which were not identified at FDR < 0.01 in the full dataset. (C) Receiver operator characteristic (ROC) curves indicate the sensitivity and specificity of DE gene classification at varying significance thresholds. For each sample size, the filled line represents the median ROC sensitivity amongst 100 bootstrap replicates, while the dashed lines represent the 0.05 and 0.95 quantiles. (D) The ability to significantly detect small effect size DE genes increases as sample size increases. At each indicated subsample size, box-whisker plot indicates effect size of true significant DE genes (The effect size and true classifications of significant DE genes are defined as those at FDR < 0.01 with the full dataset). (E) Winner’s curse effects decrease with increasing sample size. The distribution of median differences between the estimated effect size of DE genes and the true effect sizes estimated from the full dataset among 100 bootstrap replicates. (F–L) Same as (A–E) but each sample was subsampled at the level of RNA-seq reads to a depth of 25 million mapped reads. (K–O) Same as (A–E) but each sample was subsampled to 10 million mapped reads. All box-whisker plots depict 0.05, 0.25, 0.5, 0.75, and 0.95 quantiles among 100 bootstrap replicates.

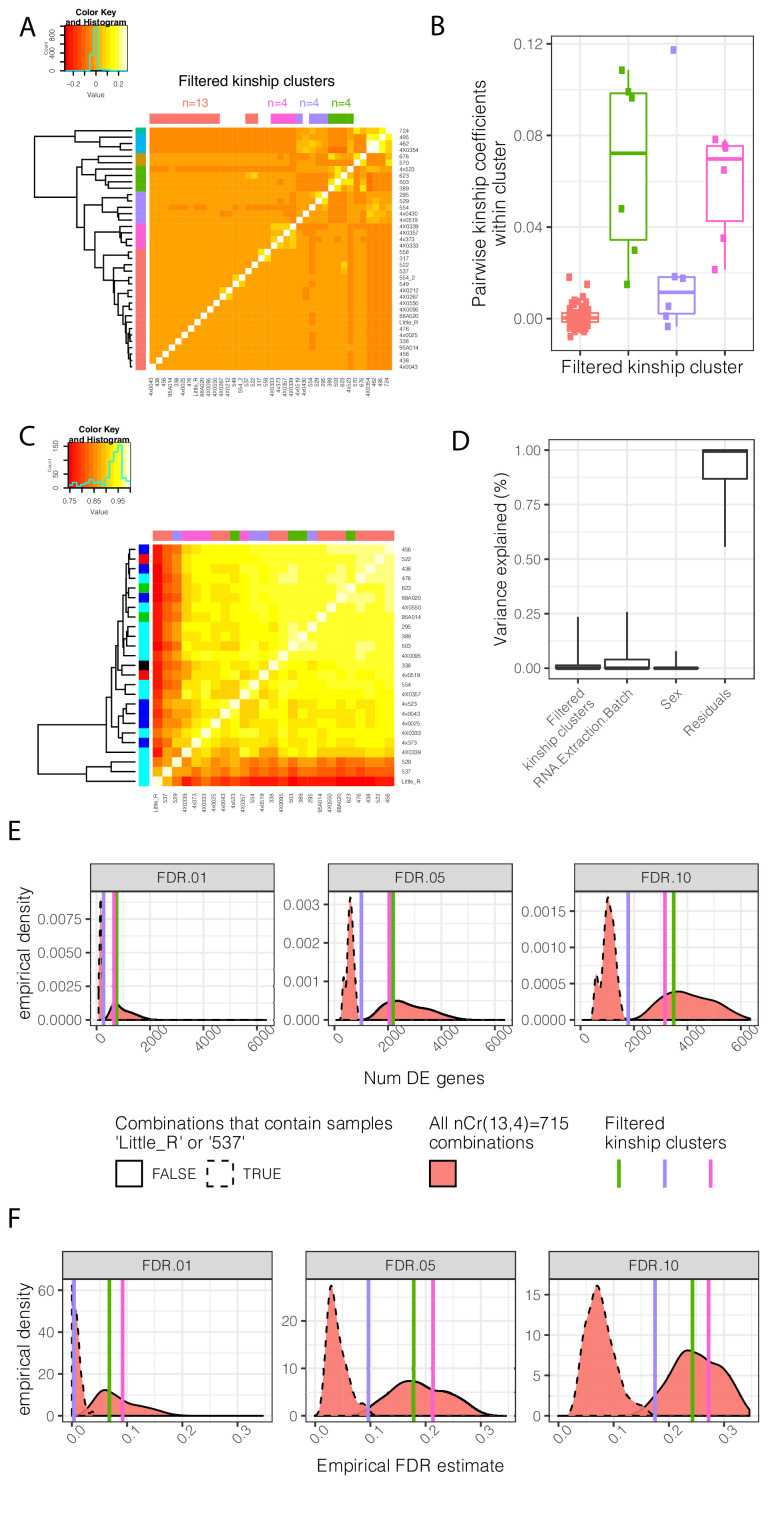
Figure 1—figure supplement 3. Contribution of genetic relatedness to differential expression analysis between chimpanzee and human.

Figure 1—figure supplement 3.

(A) A mean-centered genetic relatedness matrix of the chimpanzee individuals used in DE analysis. Samples are hierarchically clustered and further grouped into k = 7 kinship clusters (row colors). The colors used to represent each cluster is consistent throughout the figure. These clusters were further manually filtered into three clusters of size n = 4 individuals with relatively high inter-relatedness and one cluster of size n = 13 individuals with relatively low inter relatedness (column colors). (B) The distribution of pairwise intra-cluster relatedness coefficients. The contribution of these cluster annotations as factors which explain gene expression and DE power is explored in C-F. (C) A clustered gene expression (log(RPKM)) Pearson correlation matrix. Row colors represent RNA extraction batch for RNA-seq. Column colors represent kinship cluster. (D) Variance partitioning analysis using a linear mixed model with each term as a mixed effect was used to quantify the contribution of various explanatory factors to expression of each gene. Boxplots indicate the fraction of variance explained by each factor for 0.05, 0.25, 0.5 0.75, and 0.95 percentiles across all expressed genes. As there is only one replicate per individual, a model term for individual was not appropriate, and individual effects are captured in the residual. (E) DE analysis was performed using n = 4 individuals each of chimpanzee and human. The effect of inter-related chimpanzee samples was assessed by all four chimpanzee individuals from one of the three highly inter-related clusters, or by drawing a combination of four individuals (without replacement) from the lowly inter-related cluster. The distribution of number of DE genes (E) across the resampled DE analyses is shown, as well as an empirical estimate of FDR based on the full n = 39 dataset (F). DE analyses containing outlier samples Little_R or 537, originating from the same technical batch, have a much larger effect on results than drawing from inter-related samples. Kinship matrix plotted in (A) is available as Figure 1—figure supplement 3—source data 1.
Figure 1—figure supplement 3—source data 1. Kinship matrix of chimpanzees in this study.