. 2020 Oct 21;9:e59929. doi: 10.7554/eLife.59929

Figure 3. Gene features correlated with expression variability.

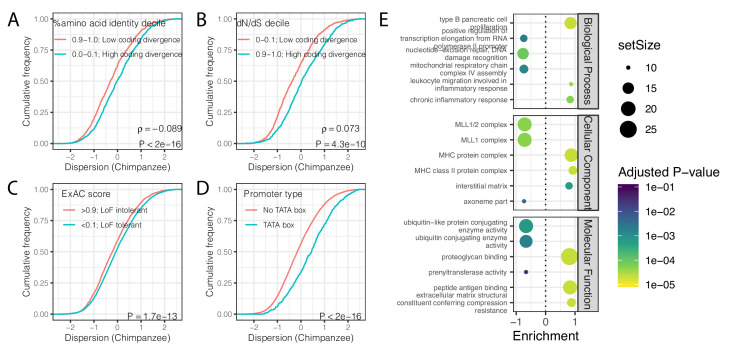
(A) Protein coding genes with high coding divergence (defined by amino acid identity between chimpanzee and human) generally have higher variability than genes with low coding divergence. The distribution of dispersion estimates is plotted as the empirical cumulative distribution function (ECDF) for the top and bottom decile genes by percent identity. (B) Same as (A) but defining coding divergence based on ratio of non-synonymous to synonymous substitution rates (dN/dS) across mammals. (C) Loss-of-function tolerant (LoF tolerant) genes, defined by pLI score (Lek et al., 2016), generally have higher variability than loss-of-function intolerant (LoF intolerant) genes. (D) TATA box genes generally show higher variability. P-values and ρ correlation coefficient provided for (A) and (B) represent Spearman correlation across all quantiles, rather than just the upper and lower decile, which are plotted for similar visual interpretation as (C) and (D), where the P-values provided represent a two-sided Mann-Whitney U-test. (E) Gene set enrichment analysis (GSEA) of genes ordered by human dispersion estimates. Only the top and bottom three most enriched significant categories (Adjusted p-value<0.05) are shown for each ontology set for space. Full GSEA results available as Figure 3—source data 1.

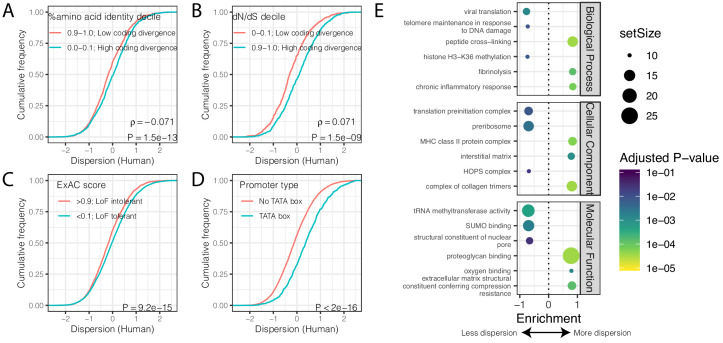
Figure 3—source data 1. Full GSEA results based on human dispersion levels.

Figure 3.

Figure 3—figure supplement 1. Correlation of coding conservation and dispersion across gene categories.

Figure 3—figure supplement 1.

(A) The correlation between dN/dS across mammals and dispersion (human-chimpanzee dispersion estimate mean) when only considering genes in three example GO categories (B) Histogram of distribution of spearman correlation test p-values across GO categories. (C) The most three most significant (Adjusted p-value<0.05) gene categories for each effect direction for each ontology group. Spearman test results for all GO categories available as Figure 3—figure supplement 1—source data 1.
Figure 3—figure supplement 1—source data 1. dN/dS correlation with dispersion by GO category.
Figure 3—figure supplement 2. Gene features correlated with expression variability (chimpanzee).

Figure 3—figure supplement 2.

(A) Protein coding genes with high coding divergence (defined by amino acid identity between chimpanzee and human) generally have higher variability than genes with low coding divergence. The distribution of chimpanzee dispersion estimates is plotted as the empirical cumulative distribution function (ECDF) for the top and bottom decile genes by percent identity. (B) Same as (A) but defining coding divergence based on ratio of non-synonymous to synonymous substitution rates (dN/dS) across mammals. (C) Loss-of-function tolerant (LoF tolerant) genes, defined by pLI score (Lek et al., 2016), generally have higher variability than loss-of-function intolerant (LoF intolerant) genes. (D) TATA box genes generally show higher variability. p-Values and ρ correlation coefficient provided for (A) and (B) represent Spearman correlation across all quantiles, rather than just the upper and lower decile, which are plotted for similar visual interpretation as (C) and (D), where the P-values provided represent a two-sided Mann-Whitney U-test. (E) Gene set enrichment analysis of genes ordered by chimpanzee dispersion estimates. Only the top and bottom three most enriched significant categories (Adjusted p-value<0.05) are shown for each ontology set for space.