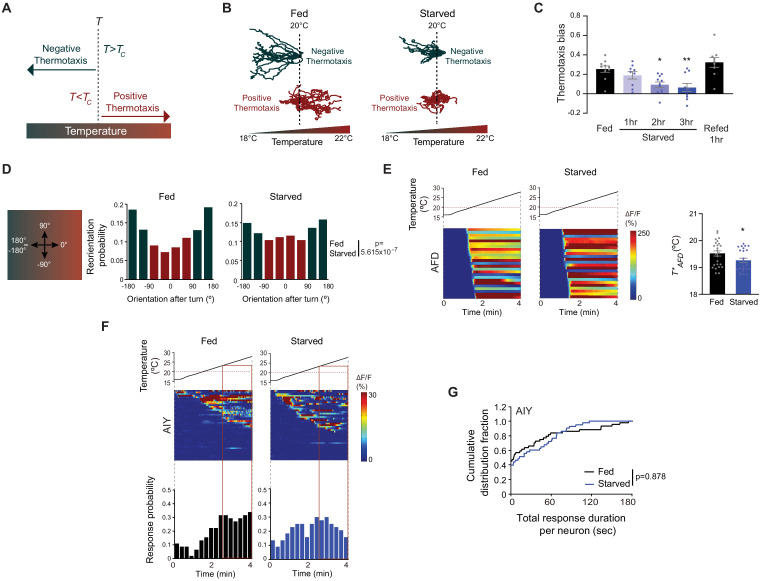
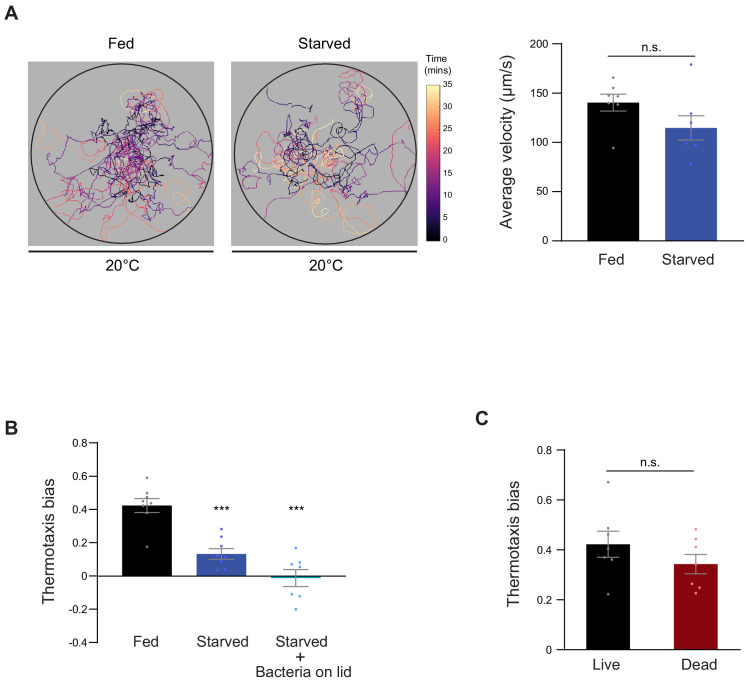
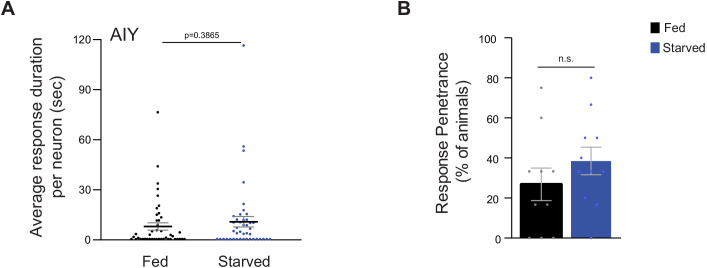
Figure 1. Starvation disrupts negative thermotaxis but does not affect temperature responses in AFD and AIY.
(A) Schematic of experience-dependent thermotaxis behavior of C. elegans (Hedgecock and Russell, 1975). T: starting temperature on gradient; Tc = cultivation temperature 3–4 hr prior to assay. Warm and cool temperatures are indicated in red and green, respectively. (B) Tracks of individual worms on a long linear thermal gradient from a single representative assay of ~15 animals each. Worms were cultivated at 15°C or 25°C for negative (green tracks) or positive (red tracks) thermotaxis assays, respectively, with (fed) or without (starved) bacterial food for 3 hr prior to assay. Dashed lines indicate the temperature (20°C) at which animals were placed at the start of the assay. Tracks were superimposed post analysis for presentation. (C) Mean thermotaxis bias of animals subjected to the indicated feeding conditions on a short thermal gradient. Thermotaxis bias was calculated as (run duration toward colder side – run duration toward warmer side)/total run duration. Each dot represents the thermotaxis bias of a biologically independent assay comprised of 15 animals. Errors are SEM. * and ** indicates different from fed at p<0.05 and p<0.01, respectively (ANOVA with Tukey’s multiple comparisons test). (D) (Left) Schematic of track orientation on a linear thermal gradient. Orientation parallel to the gradient toward warm temperatures is 0°, orientation orthogonal to the gradient is 90° or −90°, and orientation parallel to the gradient toward cold temperatures is 180° or-180°. (Right) Histograms of movement orientation following a turn. Tracks from 8 assays of 15 animals each were categorized into bins of 45°. Red and green bars indicate orientation toward the warmer/orthogonal or cooler side, respectively. The p-value was derived using the Mardia-Watson-Wheeler non-parametric test for circular data. (E) (Left) Intracellular calcium dynamics in AFD expressing GCaMP6s in response to a linear rising temperature stimulus (black lines) at 0.05 °C/s. Red dashed line indicates cultivation temperature of 20°C. Each row in the heatmaps displays responses from a single AFD neuron from different animals ordered by the time of the first response; n = 25 (fed) and 24 (starved). (Right) Mean T*AFD of fed and starved animals calculated from data shown in heatmaps at left. Each dot is the T*AFD of a single neuron. Errors are SEM. * indicates different from fed at p<0.05 (Student’s t-test). (F) (Top) Intracellular calcium dynamics in AIY expressing GCaMP6s in response to a linear rising temperature stimulus (black lines) at 0.05 °C/s. Red dashed line indicates cultivation temperature of 20°C. Each row in the heatmaps displays responses from a single neuron from different animals ordered by the time of the first response; n = 44 (fed) and 43 (starved). (Bottom) Each bar in the histograms represents the proportion of neurons responding during 15 s bins. The behavioral temperature range of 23–28°C is indicated by vertical solid lines. (G) Cumulative distribution fraction plots of total duration of calcium responses per AIY neuron calculated from data shown in F. Distributions were compared using the Kolmogorov-Smirnov test. Also see Figure 1—figure supplement 1 and Figure 1—figure supplement 2.


