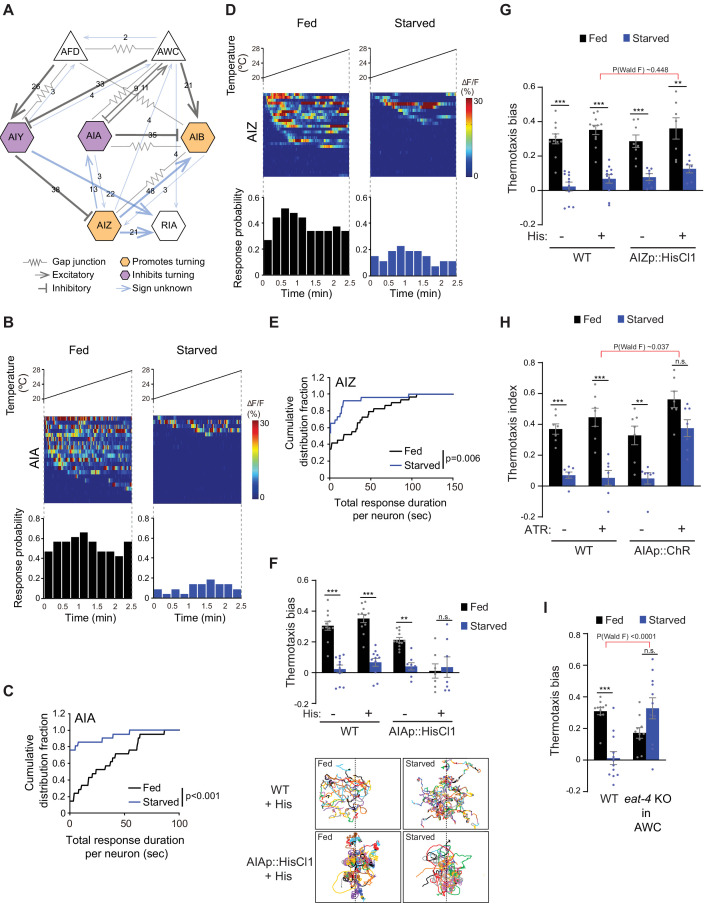
Figure 3. Inhibition of AIA temperature responses is necessary and sufficient for starvation-dependent suppression of negative thermotaxis.
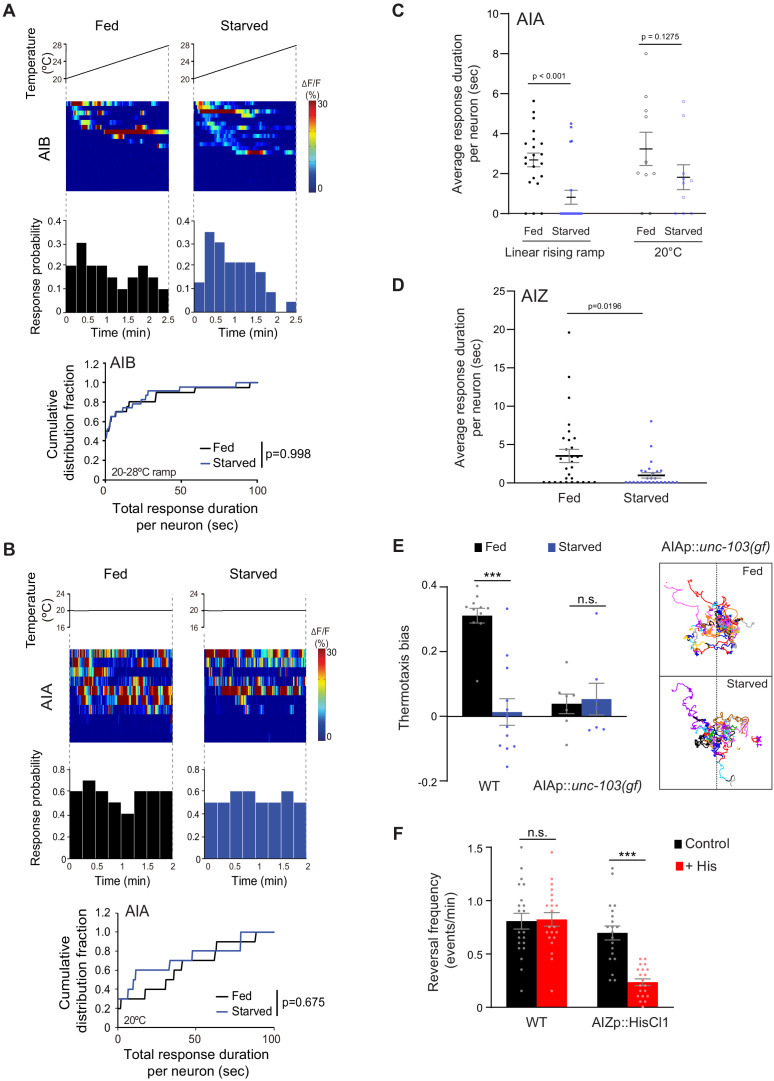
(A) Schematic of chemical and electrical connectivity of indicated sensory neurons and interneurons. Connections whose signs have not been experimentally validated are indicated in blue. Numbers of synapses (≥2) observed via serial section electron microscopy are indicated. Weights of connecting lines are scaled to synaptic strength. Color codes indicate neurons whose activity is associated with promotion or inhibition of reversals and turns. Adapted from Cook et al., 2019; White et al., 1986 (www.wormwiring.org). (B, D) Intracellular calcium dynamics in AIA (B) and AIZ (D) expressing GCaMP5A (AIA) or GCaMP6s (AIZ) in response to a linear rising temperature stimulus (black lines) at 0.05 °C/s. Each row in the heatmaps displays responses from a single neuron from different animals ordered by the time of the first response; n = 21 (AIA, each fed and starved), 29 (AIZ, fed) and 26 (AIZ, starved). (Bottom) Each bar in the histograms represents the percentage of neurons responding during 15 s bins. (C, E) Cumulative distribution fraction plots of total duration of calcium responses per AIA (C) and AIZ (E) neuron calculated from data shown in B and D, respectively. Distributions were compared using the Kolmogorov-Smirnov test. (F, G) Mean thermotaxis bias of fed and starved wild-type and transgenic animals expressing HisCl1 in AIA (F), and AIZ (G) in the presence or absence of 10 mM histamine on the assay plate (see Supplementary file 1 for genotypes). Each dot represents the thermotaxis bias of a biologically independent assay comprised of 15 animals. Errors are SEM. *** and ** indicate different from fed at each condition at p<0.001 and p<0.01, respectively (Student’s t-test). n.s. – not significant. Wild-type data were interleaved with experimental data in Figure 2A, and Figure 2—figure supplement 1C, and are repeated. P-values in red indicate Wald F-statistic from linear regression analysis for the effect of the indicated genotype on the magnitude of the feeding state effect. Traces in F show trajectories of fed and starved animals from a representative 35 min assay of 15 animals of wild-type animals and animals expressing HisCl1 in AIA on histamine-containing plates; dashed lines indicate the starting temperature of 25.5°C on the thermal gradient. Individual worm trajectories are color-coded. Since trajectories are terminated by omega turns or collisions, trajectories of the same color may not represent the movement of a single animal throughout the assay. (H) Mean thermotaxis index of wild-type and transgenic animals expressing ChR in AIA under the ins-1(s) promoter. Animals were grown overnight and assayed with or without 50 μM all-trans retinal (ATR) in the plates as indicated. Assays were performed in the presence of blue light. Each dot represents the thermotaxis index of a biologically independent assay comprised of 15 animals. Errors are SEM. *** and ** indicate different from fed at each condition at p<0.001 and p<0.01, respectively (Student’s t-test). n.s. – not significant. P-values in red indicate Wald F-statistic from linear regression analysis for the effect of the indicated genotype on the magnitude of the feeding state effect. Wild-type data were interleaved with experimental data in Figure 2B, and are repeated. (I) Mean thermotaxis bias of animals of the indicated genotypes. eat-4 was knocked out in AWC via FLP-FRT-mediated recombination (López-Cruz et al., 2019). Each dot represents the thermotaxis bias of a biologically independent assay comprised of 15 animals. Errors are SEM. *** indicates different from fed at p<0.001 (Student’s t-test). n.s. – not significant. P-values in red indicate Wald F-statistic from linear regression analysis for the effect of the indicated genotype on the magnitude of the feeding state effect. Wild-type control data were interleaved with experimental data in Figure 3—figure supplement 1E, Figure 4—figure supplement 2A, and Figure 4—figure supplement 2D, and are repeated. Also see Figure 3—figure supplement 1.


