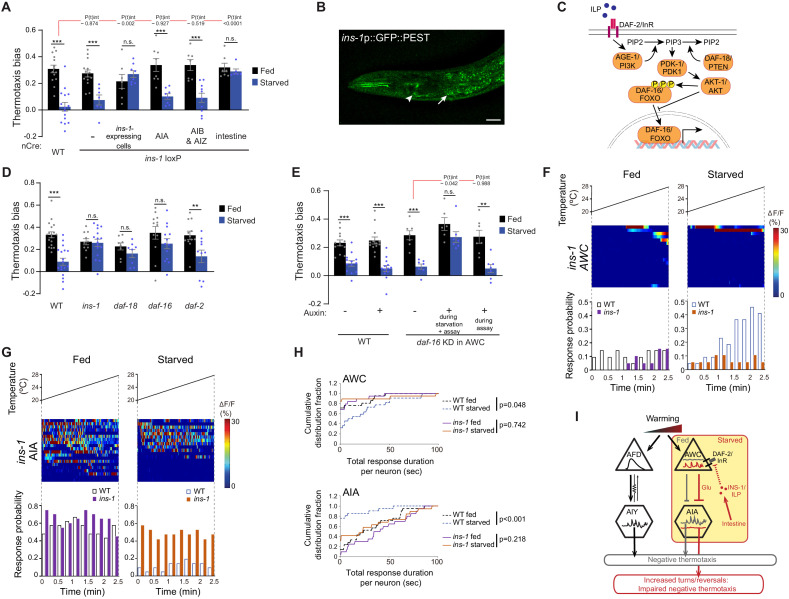
Figure 4. INS-1 insulin signaling from the gut modulates AWC and AIA temperature responses to disrupt negative thermotaxis upon starvation.
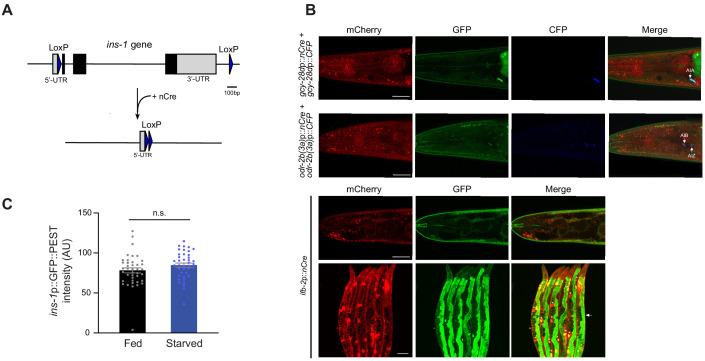
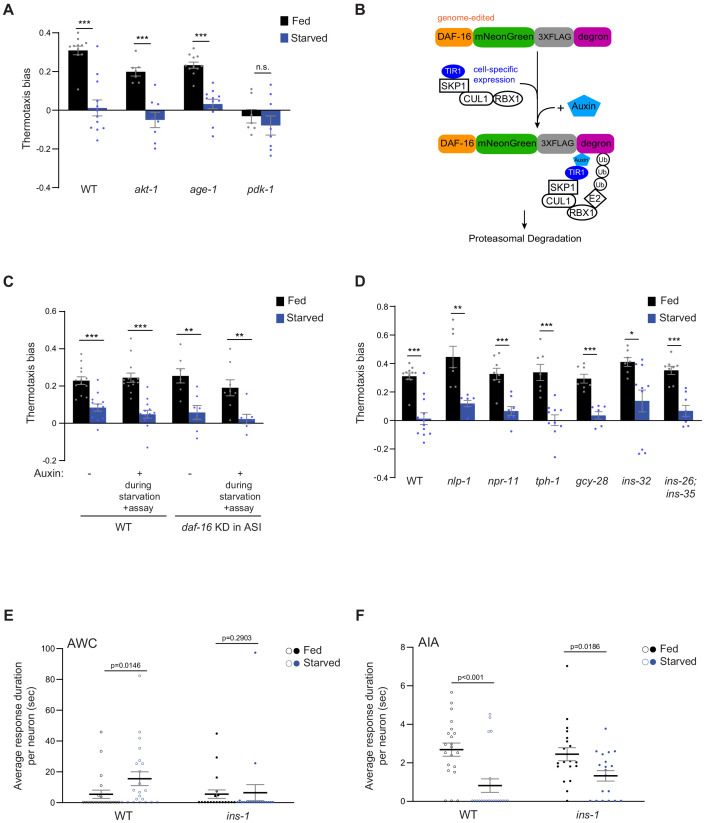
(A, D, E) Mean thermotaxis bias of animals of the indicated genotypes. ins-1 was knocked out cell-specifically via Cre-Lox-mediated recombination using ins-1 alleles flanked with loxP sequences, and cell-specific expression of nCre (A) (Figure 4—figure supplement 1A–B, Supplementary file 1). Promoters used to drive Cre::SL2::GFP expression were ins-1 (ins-1-expressing cells), gcy-28d (AIA), odr-2b(3a) (AIB and AIZ), and ifb-2 (intestine). Alleles used in (D) were ins-1(nr2091), daf-18(ok480), daf-16(m26), and daf-2(e1368). DAF-16 was depleted in AWC via auxin-induced degradation of a degron-tagged daf-16 allele and AWC-specific expression of TIR1 under the ceh-36prom2_del1ASE promoter (E) (Figure 4—figure supplement 2B). Auxin was added during starvation and to the assay plate, or to the assay plate alone, as indicated in (E). Each dot represents the thermotaxis bias of a biologically independent assay comprised of 15 animals. Errors are SEM. *** and ** indicate different from fed p<0.001 and p<0.01, respectively (Student’s t-test). n.s. – not significant. P-values in red indicate t-statistic from posthoc effect size comparisons (Dunnett’s test) between the indicated genotypes (A) or the conditions (E), respectively, on the magnitude of the feeding state effect. Wild-type data in (E) were interleaved with experimental data in Figure 4—figure supplement 2C, and are repeated. (B) Representative image of the expression pattern of an ins-1p::GFP::PEST reporter in a well-fed adult hermaphrodite. Expression in the gut and in AIA is indicated by an arrow and arrowhead, respectively. Anterior is at left. Scale bar: 20 μm. (C) Schematic of starvation-dependent inhibition of the canonical insulin signaling pathway via ILP-mediated antagonism of DAF-2. (F, G) Intracellular calcium dynamics in AWC (F) and AIA (G) neurons in ins-1 mutants expressing GCaMP3 (AWC) or GCaMP5A (AIA) in response to a linear rising temperature stimulus (black lines) at 0.05 °C/s. Each row in the heatmaps displays responses from a single neuron from different animals ordered by the time of the first response; n = 19 (AWC, each fed and starved), 20 (AIA, fed) and 19 (AIA, starved). (Bottom) Each bar in the histograms represents the percentage of neurons from animals of the indicated genotypes responding during 15 s bins. Open bars indicate data from wild-type neurons repeated from Figure 2C (AWC) and Figure 3B (AIA). (H) Cumulative distribution fraction plots of total duration of calcium responses per AWC (top) and AIA (bottom) neuron calculated from data shown in F and G, respectively. Dashed lines indicate wild-type data repeated from Figure 2C (AWC) and Figure 3C (AIA). Distributions were compared using the Kolmogorov-Smirnov test. (I) Working model of AWC- and AIA-mediated disruption of negative thermotaxis upon starvation. AFD and AIY temperature responses are indifferent to feeding state. In fed animals, low and high activity in AWC and AIA, respectively is permissive for AFD-mediated negative thermotaxis. Upon prolonged starvation, INS-1 signaling from the gut acts directly or indirectly on AWC via DAF-16 to increase temperature responses. Glutamatergic signaling from AWC inhibits AIA resulting in temperature change-uncorrelated reversals and turns and disruption of AFD-mediated negative thermotaxis. Also see Figure 4—figure supplement 1 and Figure 4—figure supplement 2.


