
Fig. 4. Venn diagram of differentially methylated CpG sites.
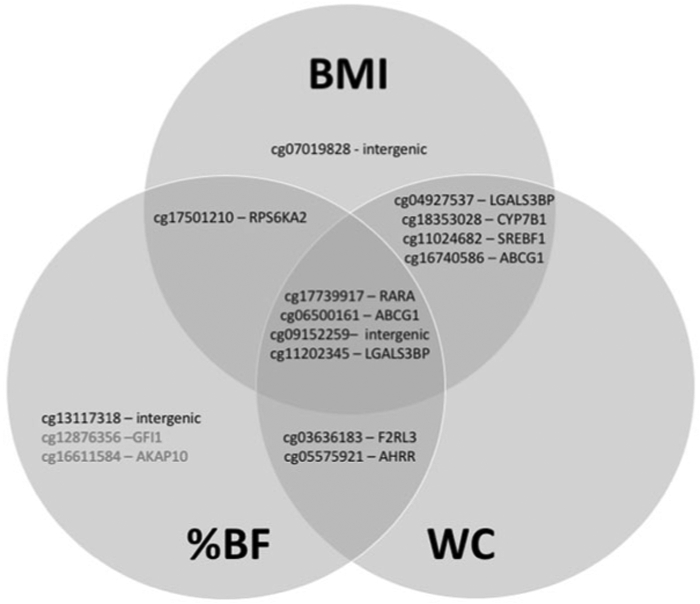
Diagram shows the top ten most significantly differentially methylated CpG sites in each of three EWAS studies (BMI, waist circumference, and percent body fat).
Official websites use .gov
A
.gov website belongs to an official
government organization in the United States.
Secure .gov websites use HTTPS
A lock (
) or https:// means you've safely
connected to the .gov website. Share sensitive
information only on official, secure websites.
Diagram shows the top ten most significantly differentially methylated CpG sites in each of three EWAS studies (BMI, waist circumference, and percent body fat).