
Fig. 6. Graphical representation of selected results from DMR analyses.
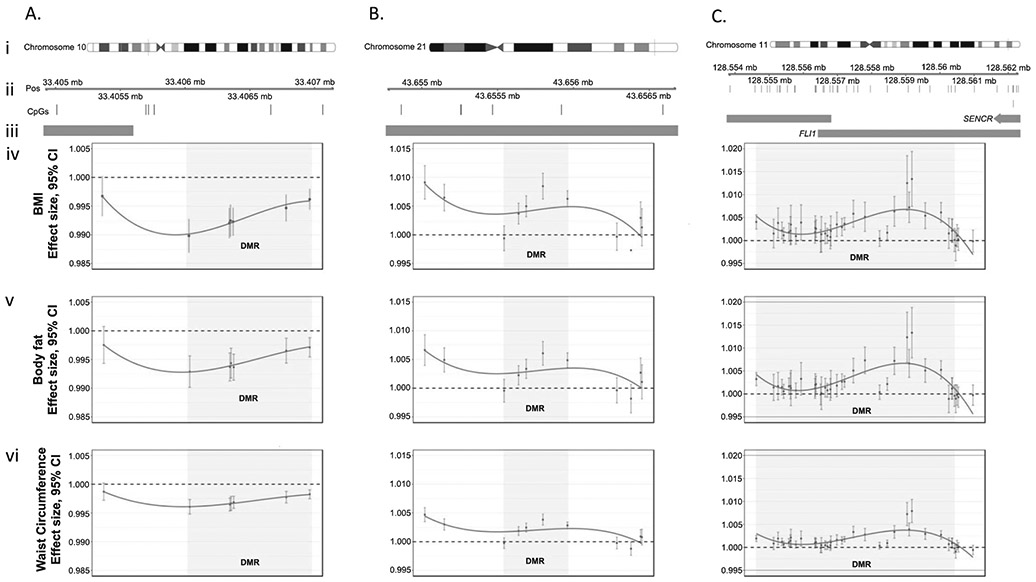
We chose three regions (a–c) with the highest number of CpG sites associated with our three outcomes (BMI, percent body fat, and waist circumference). For each region we illustrate (i) the chromosome and location of the region (ii) the expanded region and specific location of CpGs within it (iii) any overlap with promoter regions of the genome (shown as orange bars) and the effect size of individual CpGs within a region (points) and the entire region (gray shading) for each of our three response variables: (iv) BMI, (v) percent body fat and (vi) waist circumference. Within each plot (a–c iv-vi) points are connected with smoothed splines.