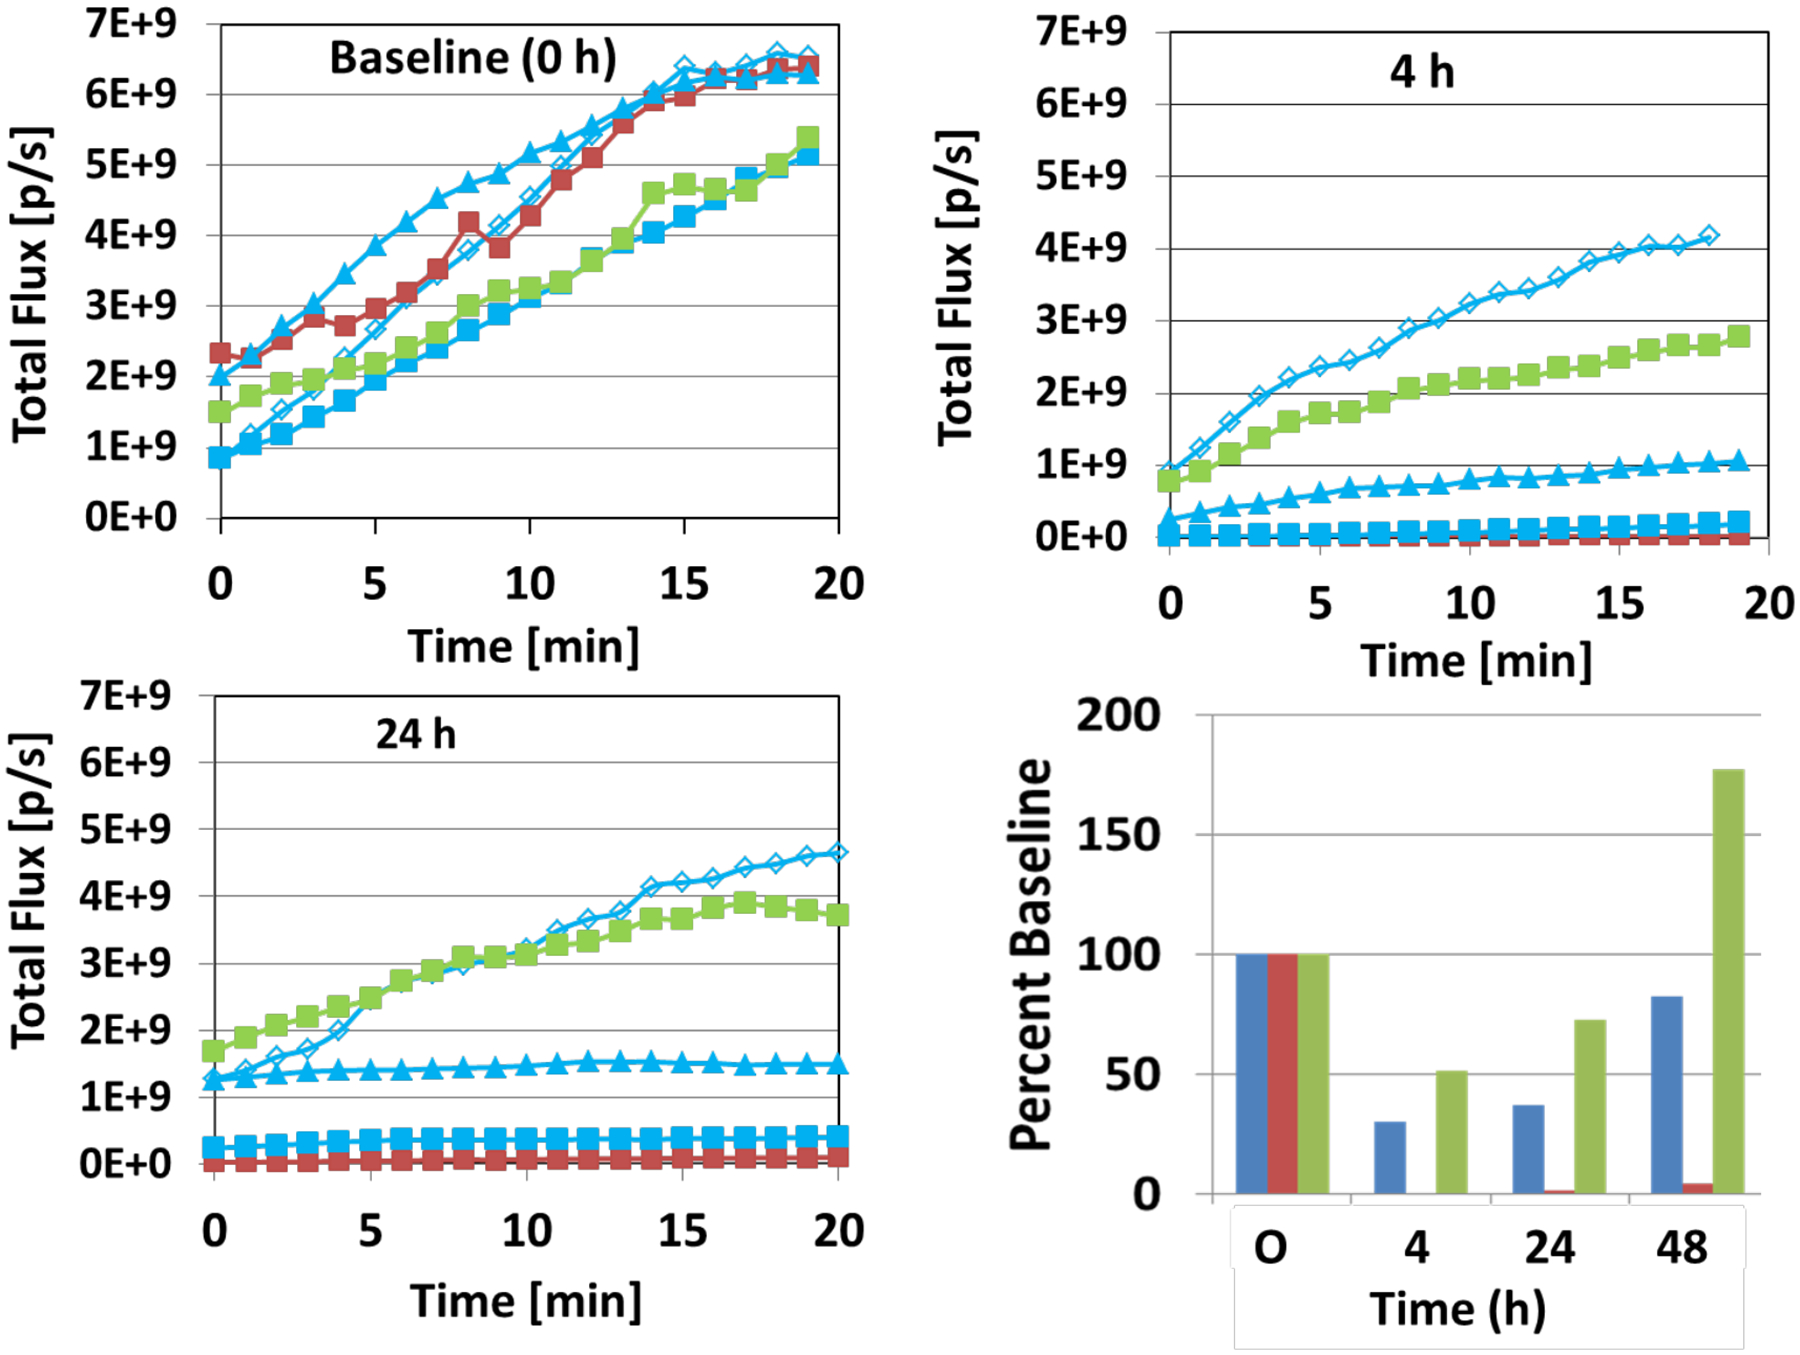
Figure 4.

Dynamic light emission time courses with respect to vascular disruption. Following administration of luciferin, BLI was performed over a period of about 20 min for the group of mice shown in Figure 3, and variation of signal intensity is shown at baseline, 4 h and 24 h. The mouse represented by the red line received CA4P (M1); by the green line received vehicle (M4) and by the blue lines each received BAPC 45 (triangles, M2; squares, M3; open diamonds, M0). At baseline, all tumors showed similar light emission kinetics (upper left panel). Four hours later, two of three tumors receiving BAPC 45 and the CA4P treated tumor showed substantially reduced signals, while one BAPC 45 treated tumor and the control tumor were relatively unchanged (upper right panel). Data for 24 h are shown in the lower left panel. The results over 48 h are summarized for the tumors in the lower right panel: red bars (CA4P); green bars (vehicle) and blue bars [mean of three tumors receiving BAPC 45)].
