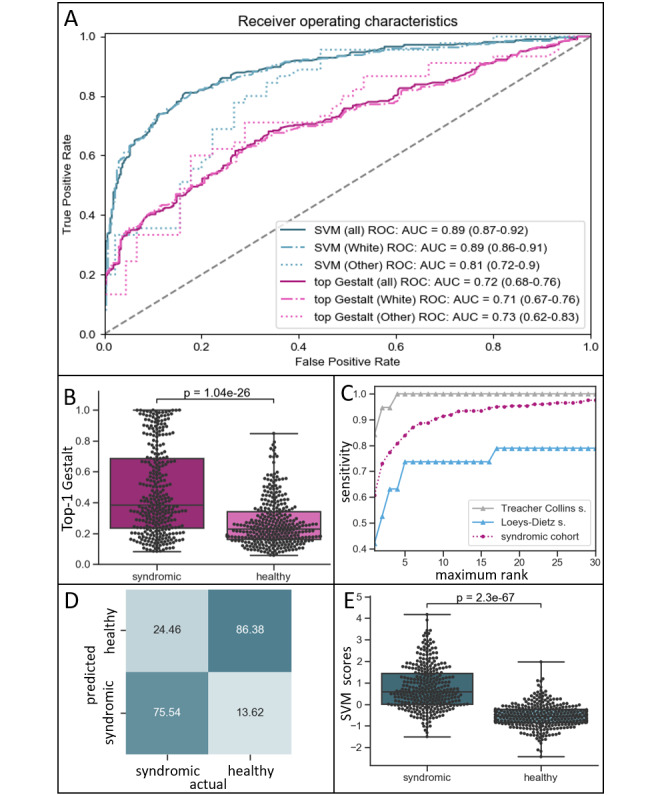
Figure 3.

(A) Receiver operating characteristic (ROC) curves: dashed line indicates random ROC curve; note that support vector machine (SVM) scores yield higher areas under the ROC curves (AUROCs) than their respective raw first-rank Gestalt scores. (B) Distribution of first-rank Gestalt scores in the syndromic cohort and the matched control cohort (healthy). (C) Sensitivities of DeepGestalt (X-axis: number of considered top ranks). Dark-purple circles: average of syndromic cohort; gray triangles: 19 images with Treacher-Collins syndrome; blue triangles: 19 images with Loeys-Dietz syndrome. (D) Distribution of SVM scores in the syndromic cohort and the matched control cohort; note: improved separability as compared to B. (E) SVM classification results based on the entire matched control cohort and syndromic cohort (threshold SVM score: 0).
