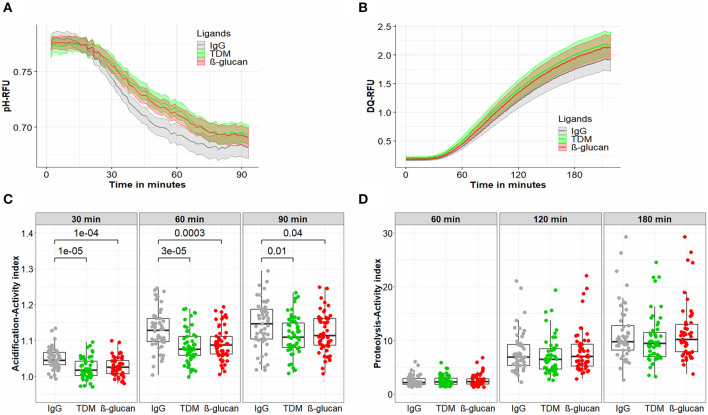
Figure 2.
Antimicrobial activities of macrophages treated with different ligand beads. hMDM from healthy volunteer subjects (n = 53) at day 7 were treated with beads coated with either IgG, TDM, or β-glucan to measure acidification activity for 90 min (A,C) or proteolytic activity for 180 min (B,D). (A) The kinetics of acidification of hMDM. (B) The kinetics of proteolysis of hMDM. (C) The acidification activity index of hMDM at 30, 60, and 90 min. (D) The proteolysis activity index of hMDM at 60, 120, and 180 min. In (A,B) the line and the shaded area represent the mean activities and 95% confidence interval. In (C,D) box plots represent the interquartile range (IQR) and median. Vertical lines above and below each box extend to the most extreme data point that is within 1.5x IQR. Each dot represents the activity index of hMDM from each subject. P values were determined by Mann-Whitney U test.

