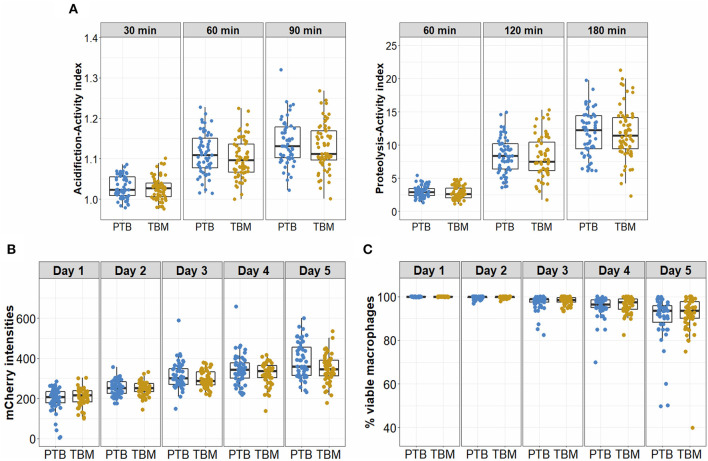
Figure 4.
Antimicrobial activities and bacterial control of macrophages from PTB and TBM participants. (A) hMDM from patients with either PTB (n = 60) or TBM (n = 64) at day 7 were treated with TDM-coated beads, to measure acidification activity after 30, 60, and 90 min, or proteolytic activity after 60, 120, and 180 min. (B,C) Macrophages derived from cryopreserved monocytes from patients with PTB (n = 52) or TBM (n = 53) at day 7 were infected with a Mtb reporter strain at MOI 1. The bacterial intracellular growth during 5 days of infection was assessed by the mCherry intensity readout (B) and the viability of infected macrophages (C). Box plots represent the interquartile range (IQR) and median. Vertical lines above and below each box extend to the most extreme data point that is within 1.5x IQR. Each dot represents the activity index of hMDM from each subject.

