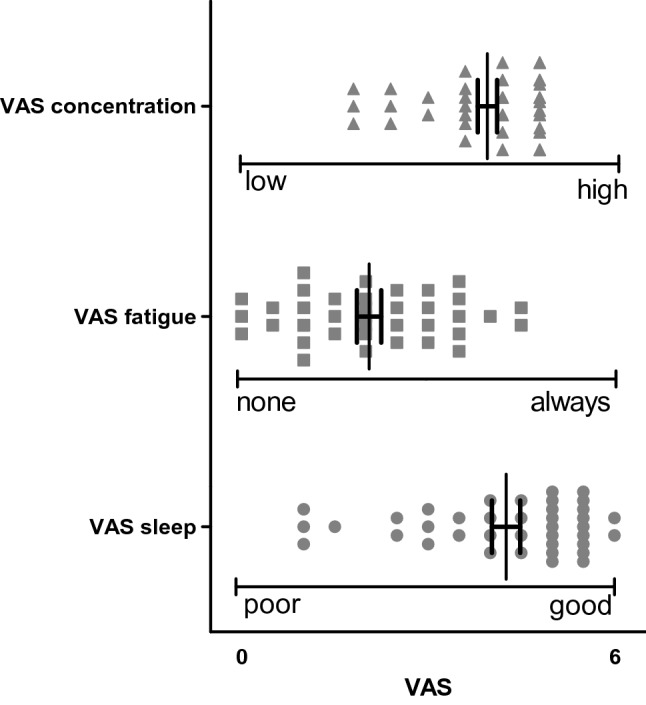
Fig. 2.

Visual-analog scales (VAS). As part of the questionnaire the VAS measured the level of concentration during revision (0 = low to 6 = high), the occurrence of feelings of fatigue (0 = none to 6 = always) and the quality of sleep (0 = poor to 6 = good). The scatter plot gives the results of the single subjects as well as the mean and SEM. None of the VAS parameters correlated significantly with the revision time given in the diary or in the questionnaire (for all correlations: Kendall’s tau < 0.15 with p < 0.27)
