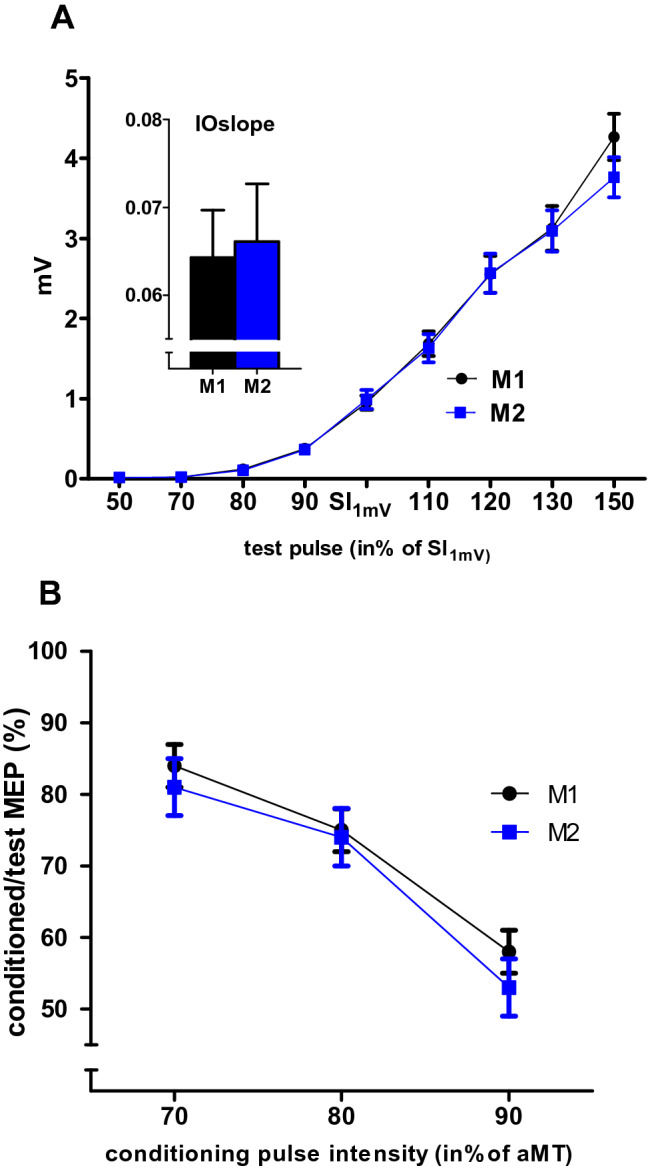
Fig. 3.

Motor excitability: IOcurves and SICI in the APB. a IOcurve: the mean MEP amplitude (in mV ± SEM) as given on the y-axis against the stimulus intensity given on the x-axis (in percentage of SI1mV) measured before (M1; black) and after (M2; blue) the cognitive training. The inset figure displays the IOslope calculated for the approximately linear part of the IOcurve between 80% and 120% SI1mV. IOcurves and IOslopes were not different in M1 and M2. b SICI obtained with a conditioning pulse intensity of 70%, 80%, and 90% of aMT. The y-axis plots the amplitude of the conditioned MEP as the percentage of MEP evoked by the test pulse alone (± SEM). SICI increased with increasing conditioning pulse intensity; however, there was no significant difference between M1 and M2
