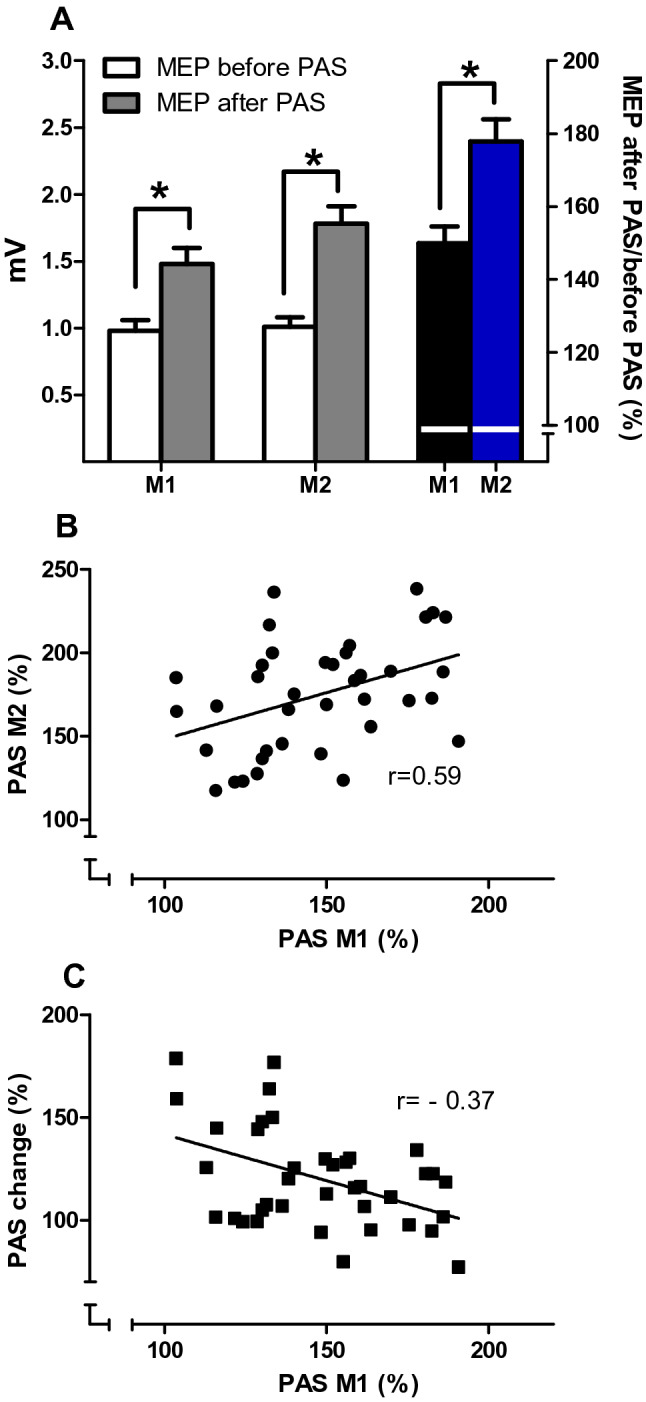
Fig. 4.

a Mean MEP (± SEM) in the APB measured before (white columns) and after (grey columns) PAS at M1 and M2. In M1 and M2 there was a significant increase of MEP amplitude (both paired t-tests; p < 0.001). The PAS effect (MEP after/MEP before PAS, in %; right y-axis) was different in M1 (black column) and M2 (blue column) (paired t-test; p < 0.001). (*Marks significant results; paired t tests, with p < 0.001). b shows the correlation of the PAS effects measured at M1 and M2 and c the correlation of PAS M1 to PAS change. Both correlations were significant (p < 0.018); the coefficients are given in the figure
